With billions of monthly active users, you can assume there are quite a few Instagram stats available nowadays. Why do these numbers matter? Outside of general interest, facts about Instagram and its users can be heavily beneficial for a broad number of reasons.
It could be developing refined marketing strategies or simply learning what approach to take with content creation. Instagram has been in our lives for well over a decade now, and it has changed drastically since the beginning.
Marketing strategies for this platform are extremely diverse and cater to a range of efforts geared toward B2B and B2C. To get a grasp on the social platform in today's world, it's helpful to go through the facts. In this article, you're getting a multi-layered look into 12 must-know Instagram stats for marketers.
Instagram User Demographics and Usage Statistics
Between demographics and platform usage, there's a lot of data you can use to your advantage. Gaining an understanding of this is one of the first steps to creating a winning marketing strategy. Instagram demographics can offer insight into who your audience is, what content they respond to, and many other relevant details.
For the most part, these stats focus on things like user age, location, gender, and various aspects of device usage as well. On a side note, there are many tools on the market that can help you keep track of the data, and our YouTube tutorial makes it easy to understand.
1. Global User Breakdown by Country and Age
Although we’re already halfway through 2025, there’s plenty of available and actionable data to go around. Instagram statistics vary far and wide, especially when you’re looking at country and age. For starters, the table below dives into percentages between male and female users based on age group.
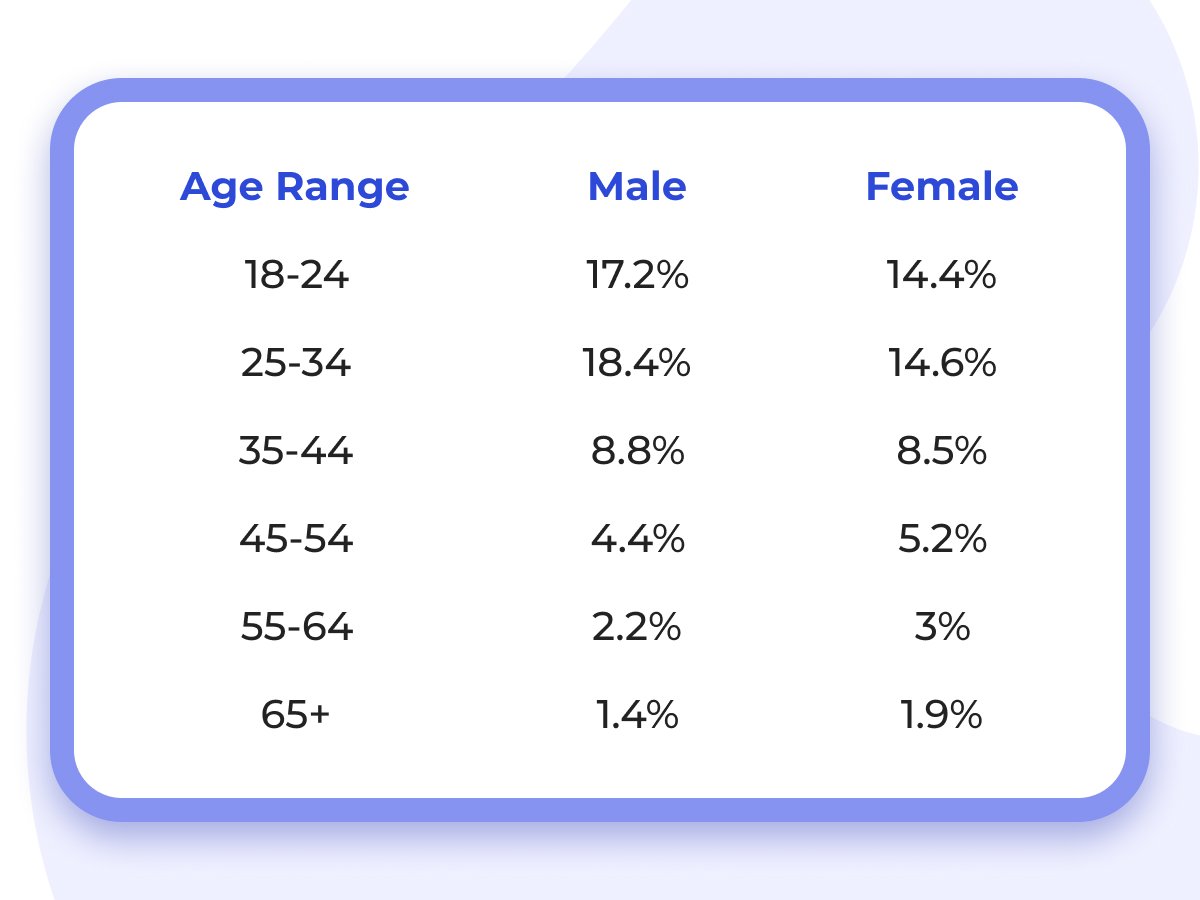
Overall, it’s the 18-34 crowd that makes up a majority of Instagram users. When you review the data based on countries, it really shows where the platform grew in popularity.
Here’s a quick look at the top 10 leading countries for the platform’s audience:
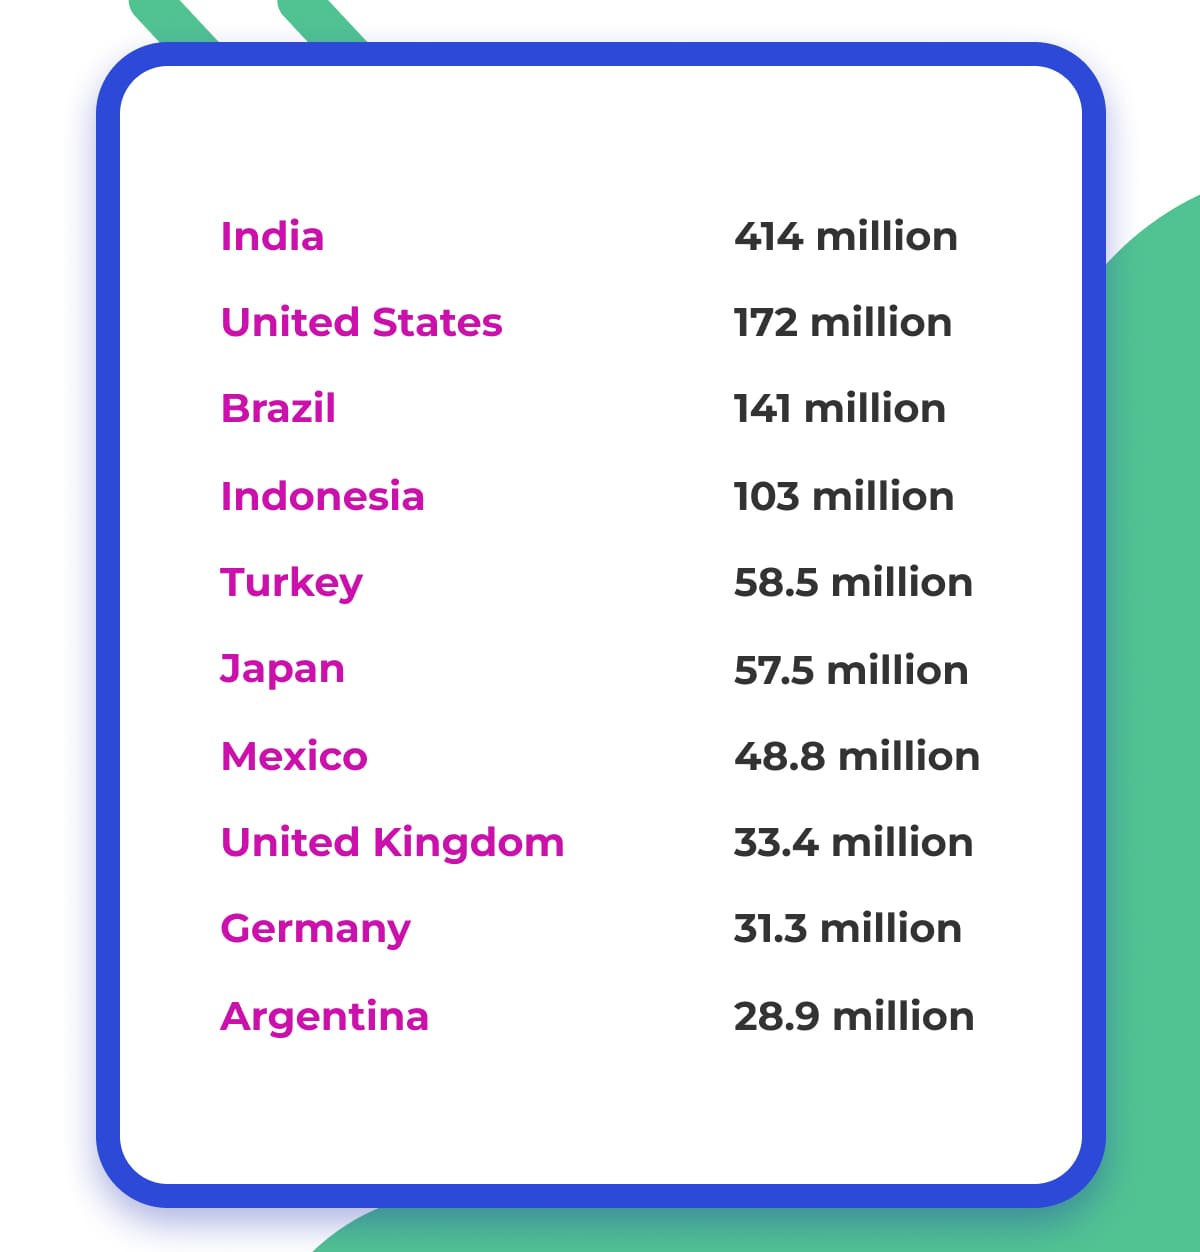
When it comes to specific regions, the data gets a lot more finite, but this shows where most of the platform’s audience resides.
2. Specific User Trends in Content Interests
As you might expect, a lot of Instagram engagement comes from a focus on entertainment. To be more specific, 86% of users mention that’s the main reason they’re on Instagram. Based on the stats in the previous section, it's also safe to say that the younger generations are driving the bulk of these numbers.
You can find a few more stats below that offer a look into the bigger picture of user trends and interests:
- 56% of those involved mentioned entertainment as a major reason
- 83% use it as a primary means of staying in touch with close friends and family
- 75% specifically use Instagram to connect with others who share similar interests
- 26% are on the social platform to keep up with current politics
- 52% have made an Instagram account to dive into sports and pop culture
- 33% are looking for current news updates
- 44% are a fan of product reviews and recommendations
The most popular posts end up that way for a reason. While virality is a factor as well, popularity generally stems from catering to popular audiences.
3. Daily and Monthly Active Users and Time Spent
Out of all of the social media platforms that are popular today, Instagram carries some of the most daily active users. In present day, Instagram is seeing over 500 million active users on a daily basis. This is expected to grow as the social platform continues to innovate and find new ways to keep younger users engaged.

Oddly enough, monthly active users (MAU) have dropped a bit over the last few years. In 2023, the platform’s audience was bringing in 2.4 billion MAUs. By 2024, this figure had dropped to around 2 billion, but engagement on the platform is still booming.
When you take into account that 36.7% of the world’s internet users are on Instagram, you can expect the number of daily active users to be pretty high.
Instagram Engagement Benchmarks
A crucial component of any social platform, engagement is what drives a lot of user interaction and interest. What makes this tricky over time is that it isn’t always easy to drive engagement unless you have a winning strategy. You don't need to chase every passing trend, but integrating this into your content schedule can do wonders for your Instagram profile stats.
4. Median Engagement Rates by Industry
Taking a look at how different industries navigate Instagram, it’s pretty clear that engagement is more consistent in some sectors than others. From this particular dataset, higher education seems to get the most engagement per post, sitting at 2.1%. The lowest engagement per post is split between health, beauty, and home decor at 0.14%.
The list below dives into several leading industries and the average engagement rate for every post:
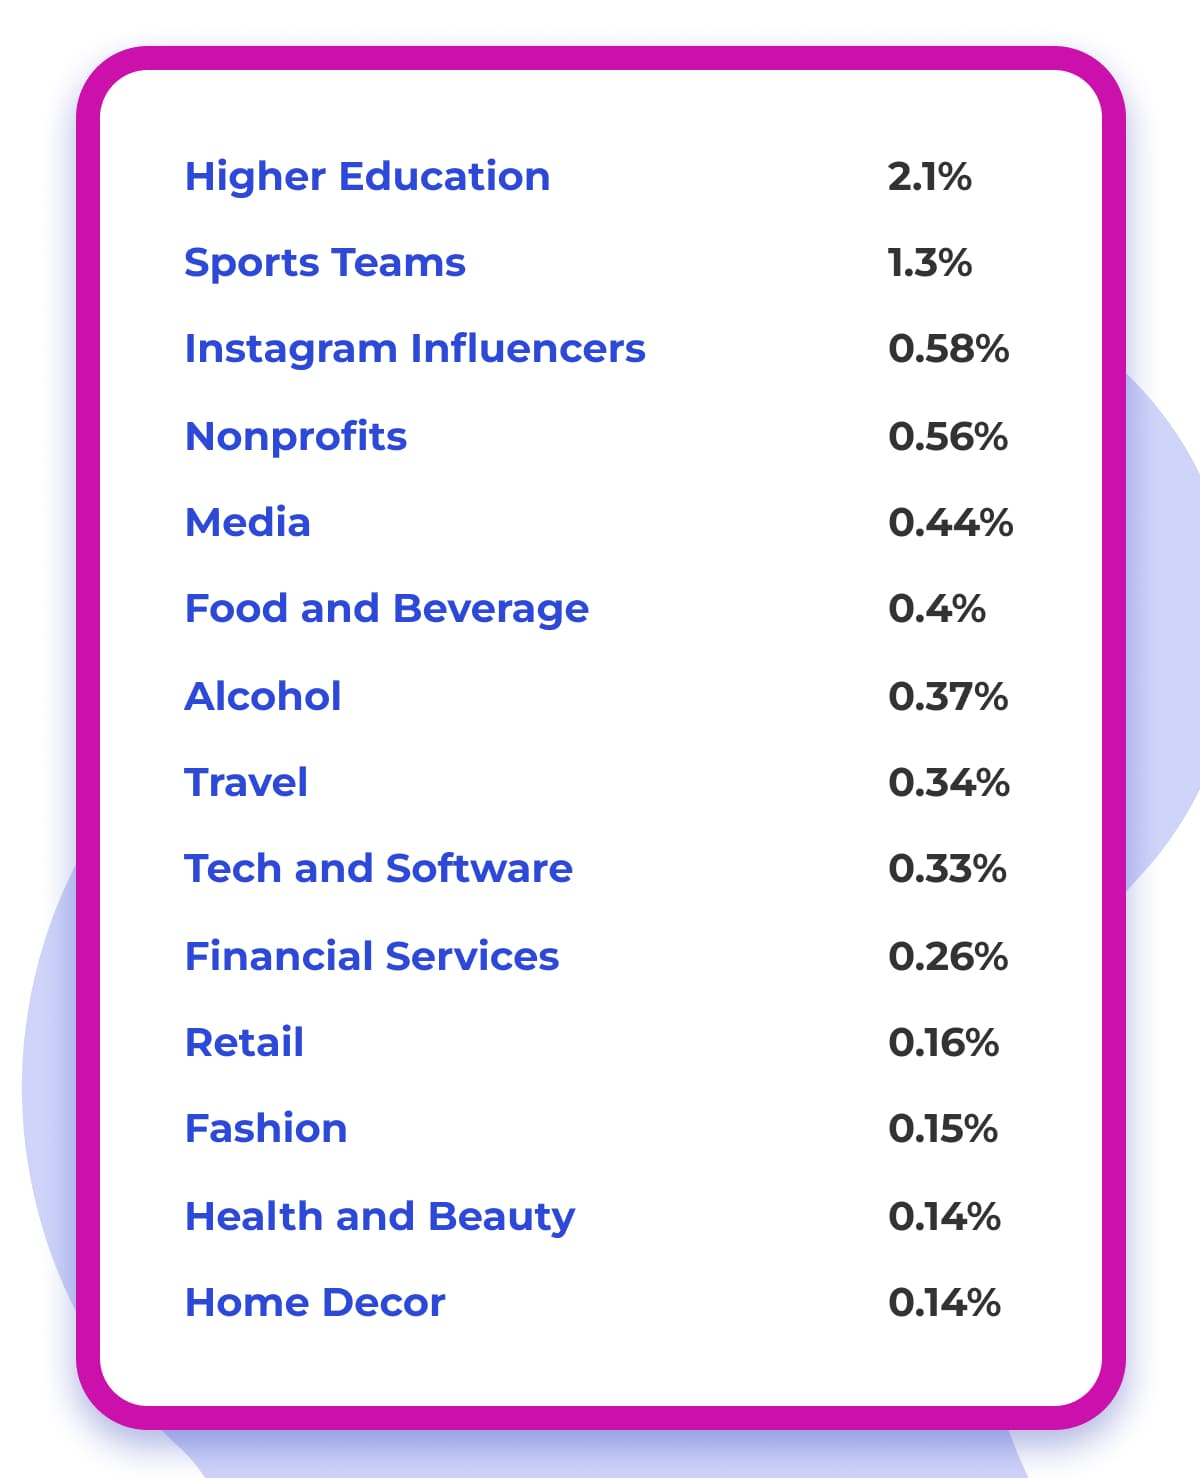
To help simplify the data for you, the median engagement per post across all industries is 0.36%. Some of these numbers may not sound like much, but Instagram has proven it doesn’t always take much to make a large impact.
5. Carousels vs Reels vs Static Image Performance
You might be surprised to learn that carousels are driving the best engagement right now with 0.55%. For a better gist of this comparison, the list below offers a quick look at how the content styles compare with average engagement rates.
- Carousels: 0.55%
- Reels: 0.50%
- Static Image: 0.45%
They don't differ significantly, but carousels are great, considering the number of posts you can include. These percentages aren't the only numbers that matter in this comparison. Although carousels are currently sitting at the top in this category, they've seen a 15% year-over-year decline.
It’s also important to keep in mind that engagement comes from many different sources. Views, likes, and comments are just a few examples. Instagram Reels may not drive as much engagement as carousels, but they do much better with the comment section.
Static images have been around since the beginning, but they aren’t what’s most popular on the platform today. Considered to be a classic format on Instagram, it isn't the go-to for most people. Aside from this fact, static images make up roughly 50% of all brand posts on the platform.
The Instagram algorithm has changed many times over the years, which also affects how engagement is driven. It's these kinds of changes over time that lead to the need to refine marketing strategies over and over again.
6. Highest Engagement of Posts From Influencers
Remember that this section specifically focuses on influencers, so the data is entirely focused on these types of creators. Nevertheless, the average engagement rate for influencers is 1.8%. Reels are driving the most engagement for this category at 2.08%. Carousels come in second at 1.7% and static posts at 1.17%. If it’s just a post with text, the engagement rate drops even lower to 0.42%.
The average of 1.8% may not sound like much, but in the context of millions of followers, the analytics can be sizable. Audience interaction factors in many data points, but when it comes to having influence, it’s a bit easier to drive those numbers.
Marketing and Advertising Performance on Instagram
Since Instagram is one of the leading social platforms across the entire world, it’s understandable that it would be a huge marketing hub. Between Instagram and other relevant social media marketing tools, you can find quite a bit of success. After years of trial, error, and refinement, current data highlights how marketing on the platform affects ROI, Instagram ads reach, and more.
7. Advertising Revenue for Instagram
If you work in marketing and haven't been promoted through Instagram before, it’s never too late to start. Taking a look at the data, it’s evident that companies all over the world are happily pouring money into Instagram ads.
For the U.S. market, Instagram’s advertising revenue soared to $71 billion by the end of 2024. This isn't to say other platforms aren't popular, but there are many reasons why Instagram draws so much marketing interest from businesses.
Take note that ad revenue considers many layers of the Instagram platform. For example, that revenue could be broken down between ad space, the type of content that was used, and many other parameters.
For another example, ad revenue from Instagram Stories was on track to generate $20.3 billion in 2023. Instagram faces its fair share of ups and downs on a yearly basis, but that doesn't mean they aren't doing well with ad revenue.
8. Potential Ad Reach
Looking to optimize your marketing campaigns? It helps to check what the potential ad reach might be. With Instagram, the most recent figure for this is 1.84 billion. That’s a staggering number, but it’s important to discern that this is solely focused on potential reach.
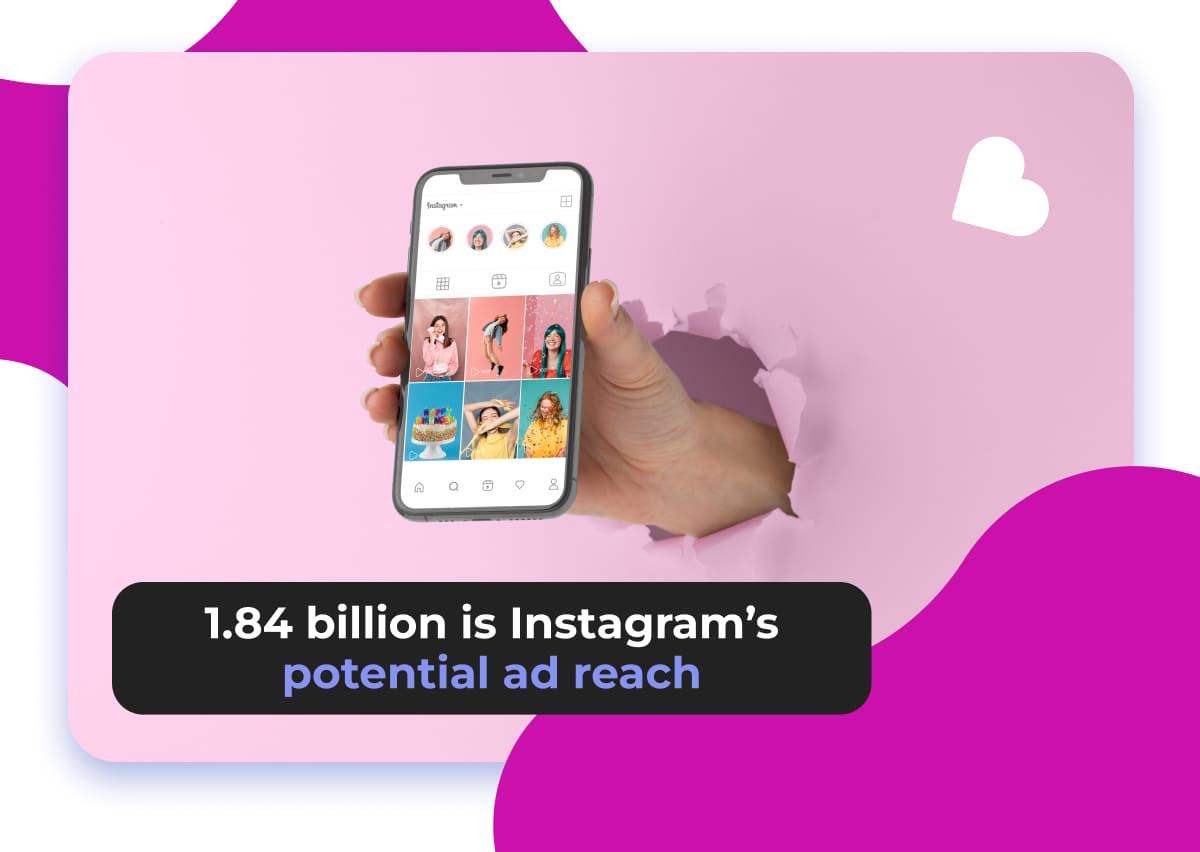
However, considering certain marketing limitations, a lot of your material will only end up in front of the 18+ crowd. This factor has a direct effect on the potential ad reach and drops the previous figure from 1.84 billion to 1.76 billion.
Regardless of how significant that number sounds, your specific target audience will more than likely be a fraction of that number. Of course, this depends on the industry you’re working with, as well as the parameters in your targeted campaigns.
9. Effectiveness of Instagram Ads
Although this dataset is relatively niche, it shows how consumers navigate social platforms to follow the brands they're interested in. This data changes year over year as well. With Instagram, 38% of respondents sided with the platform, but that figure changed to 45% by 2024.
Out of all popular social platforms used for ad space, Instagram ranks 3rd, with Facebook and YouTube leading the way. That 45 on Instagram’s part is only focused on the general population. However, if you look at it from the perspective of different age groups, these figures can change a lot.
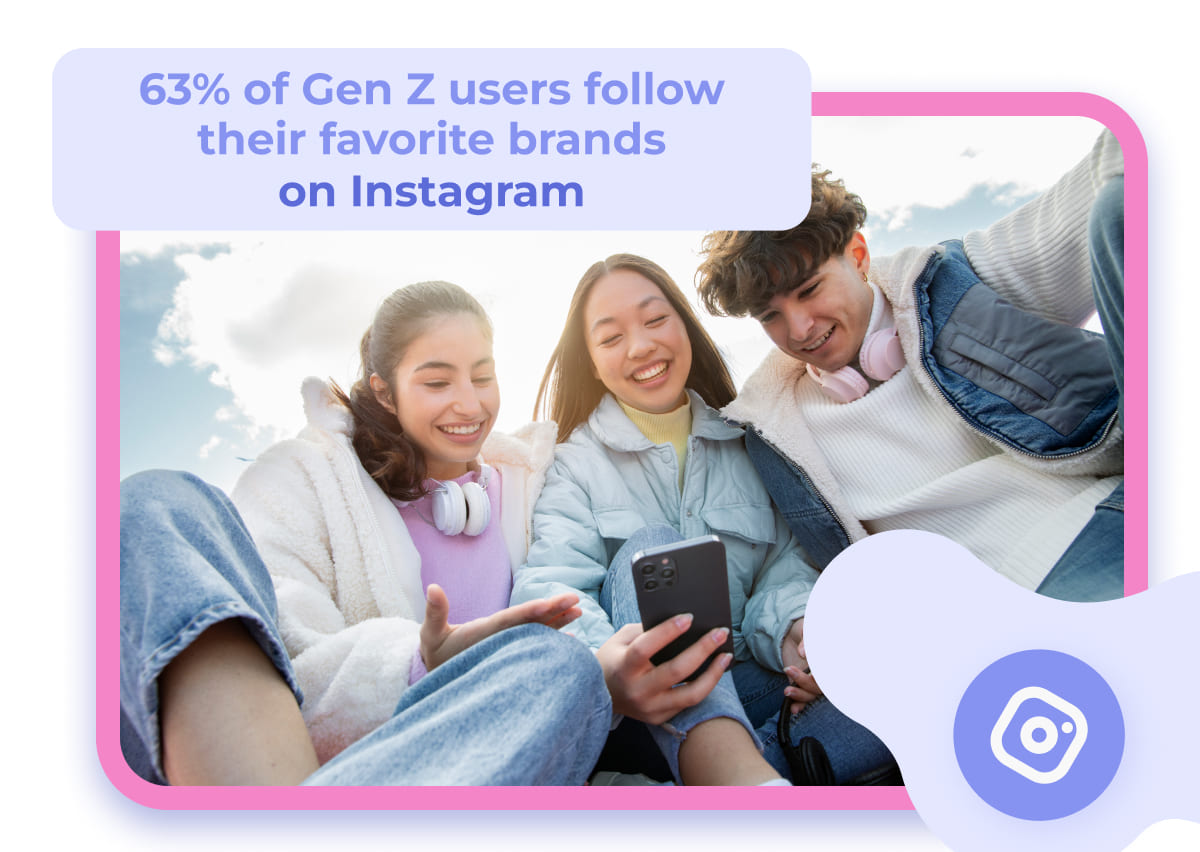
A good example of this would be with Gen Z users, as 63% of respondents use Instagram to keep track of their favorite brands. Instagram has always been run by the younger crowd, which is the same driving factor that has promoted change to the app for years.
Instagram Content Trends Across Various Formats
With several posting formats to choose from, you have several options when it comes to getting creative with your content. Trends in this space change rapidly, and the same can be said of the content you use in your ad space. Even though Reels are clearly a popular choice, Instagram stories and other post formats play their part as well.
10. Your Instagram Stories Content Schedule
You may have heard of this rule in other areas of life, but the 50-30-20 rule applies to posting content as well. More specifically, it applies to Instagram Stories in more ways than one. The list below offers insight into the type of content you should be posting on your Stories.
- Value Content: 50%
- Engagement Content: 30%
- Connection Content: 20%
Another detail to take note of is that 85% of Instagram users view content with the sound off at all times. This means you shouldn’t rely so heavily on audio alone, and having captions available can make a huge difference in results.
11. Average Reach of Instagram Reels
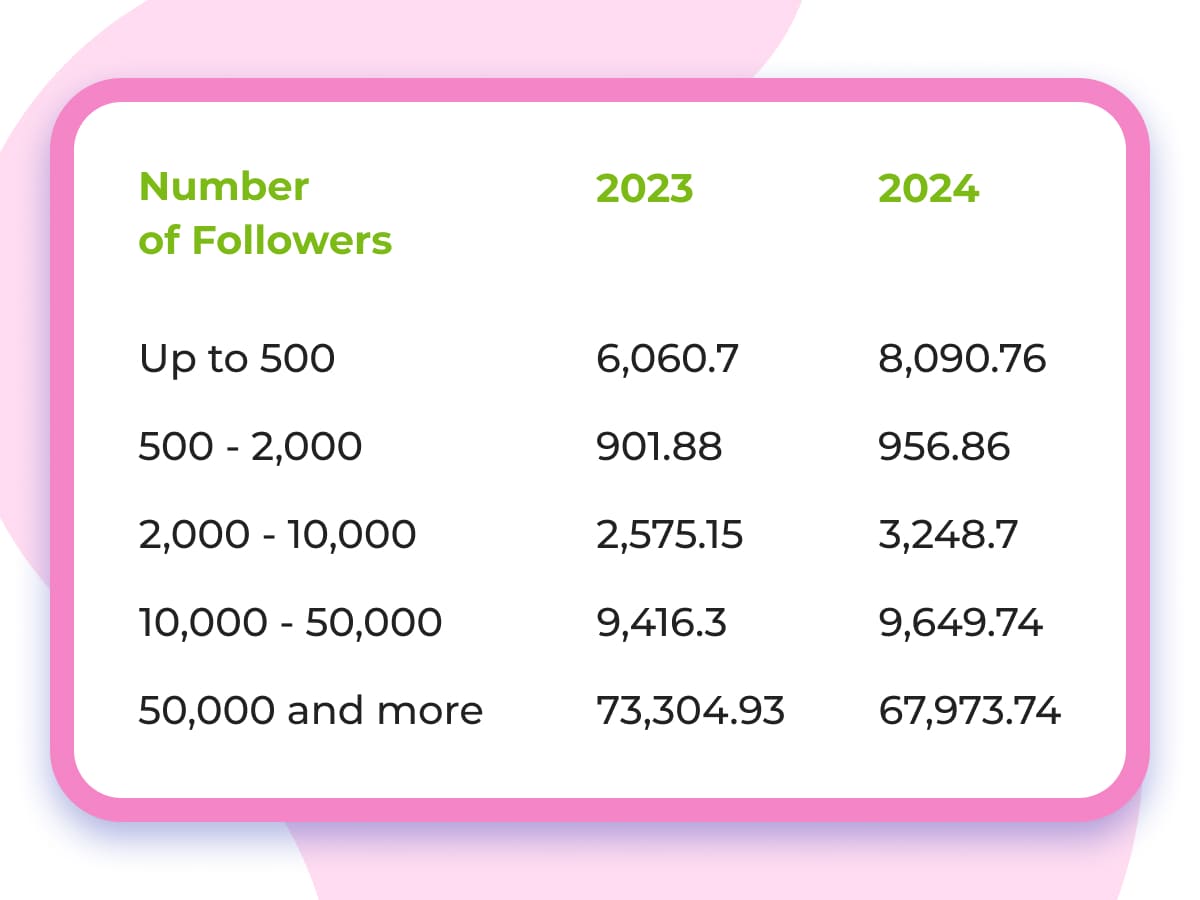
As mentioned earlier, engagement focuses on several unique metrics, with reach being a strong focus area. Instagram Reels have been heavily popular for some time now. While follower count isn't the most important metric, it'll evidently have an effect on how reach happens in different markets.
To simplify, some of these accounts with up to 500 followers barely broke 8,000 for average reach on their Reels. Looking at accounts that have 50,000 or more followers, and the most recent average shows 67,973.74. It might sound like a big jump, and it is, but that doesn’t guarantee it’s targeted well. Below, you can find more figures pertaining to reach for Instagram Reels and how they differ from 2023 to 2024.
You can also look a little deeper and find content trends in how people interact with Reels on the social platform. From comments to likes, shares, and more, users engage with Reels in several ways.
12. Average Reels Engagement Based on Interaction Type
Some users just like to watch Reels and scroll for hours without actually engaging any further. Others like to dive into one comment section after another. All of these user traits play into the average engagement for Reels.
Here’s what the average engagement data looked like for Reels in 2024 based on the type of interaction:
- Views: 15,000
- Likes: 805
- Comments: 25.72
- Saves: 82.04
This is a pretty decent average, but those numbers won't be the reality for everyone. The point is that Instagram Reels can be a lucrative format for individuals and businesses alike. As you might expect, these figures by the end of 2025 will surely look a tad different. Analytics changes on a daily basis, so you just have to do your best to create content that aligns with your target audience.
Final Thoughts
You could dive into a rabbit hole of data and statistics surrounding the Instagram platform. It has been around for a long time and is essentially an entirely different social medium from where it started.
Whether you’re an everyday user, influencer, or brick-and-mortar business, Instagram is a viable marketing and engagement tool. No matter how challenging it might seem, social media is a must for many people trying to get their name or business out into the world.
Sources of Instagram statistics: Statista.com, datareportal.com, marketingcharts.com, rivaliq.com.
FAQ
Is Instagram effective for marketing?
This is an understatement, as Instagram and Meta, in general, are some of the leading marketing platforms in the modern day. Whereas things like Google Search used to be a primary marketing tool, it’s now on the backburner compared to Instagram and Meta.
How to check my Instagram statistics?
If you aren’t exactly sure where to find your analytics, it’s a lot easier than you might think. Follow the simple steps below to get a direct look at your most current Instagram profile analytics.
- You’ll need to make sure you have a business or creator account
- Tap on your Professional Dashboard to go to your profile insights
- Dive deeper into the metrics and find out where the engagement is coming from
You can also adjust the dates to get a look at how your insights have shifted over time. Reviewing this data regularly can definitely help to optimize your content approach.
What does an Instagram Tracker do?
If you aren’t sure what an Instagram Tracker does, it’s something that can take a lot of the manual work off your shoulders. Monitoring analytics and content has never been easier, and it’s easily usable by everyday users and businesses alike.
An Instagram stats Tracker follows engagement data, as well as the numbers in your follower growth. In addition to likes, comments, as well as changing engagement trends. You get the benefit of anonymous monitoring, as well as cross-device access.

![How to Find Users on Instagram? [+ Universal Instagram Search Tool]](/uploads/content/instagram-universal-ic.jpg)