How to Use Profile Analyzer for Deep Competitor Research: Engagement, Audience, and Top Posts


Understanding your competitors' Instagram performance isn't about copying them. It's about finding content gaps and making data-driven decisions instead of guessing. Inflact's Profile Analyzer gives you access to public Instagram data with metrics you won't find through the app's native interface.
Why manual competitor analysis doesn't work
Trying to analyze a competitor by scrolling through their profile has serious limitations:
- You can only see raw like and comment counts- no calculated engagement rate.
- No historical data on follower growth or posting frequency.
- You can't compare multiple competitors side by side.
- Manual counting of likes and comments on recent posts takes 1-2 hours per account.
- No way to export data or track changes over time.
What makes Inflact Profile Analyzer different
Inflact's tool gives you access to public Instagram analytics without logging into your account. You don't need to provide your password, and your research remains completely anonymous. Simply enter any public username, and the tool generates a comprehensive report covering 13+ metrics.
Key capabilities:
|
Feature |
What it does |
|
Engagement Rate |
Calculates average likes and comments per post divided by followers, multiplied by 100 |
|
Account Score |
Internal metric evaluating posting consistency, content quality, and follower authenticity |
|
Rankings |
Shows worldwide, country, and category position compared to similar profiles |
|
Follower Trends |
Visual graphs tracking growth over time, detecting spikes or drops |
|
Publishing Frequency |
Identifies best times and days for posting based on last 100 publications |
|
Top Caption Words |
Highlights most frequently used words and phrases |
|
Semantic Analysis |
Evaluates emotional tone: positive, neutral, or negative |
|
Similar Profiles |
Discovers accounts with overlapping audiences |
|
Top Performing Posts |
Identifies most liked and most commented content |
Important: The tool only analyzes public profiles. Private accounts are never accessible, which aligns with Instagram's privacy rules.
How to use Profile Analyzer for competitor research step by step
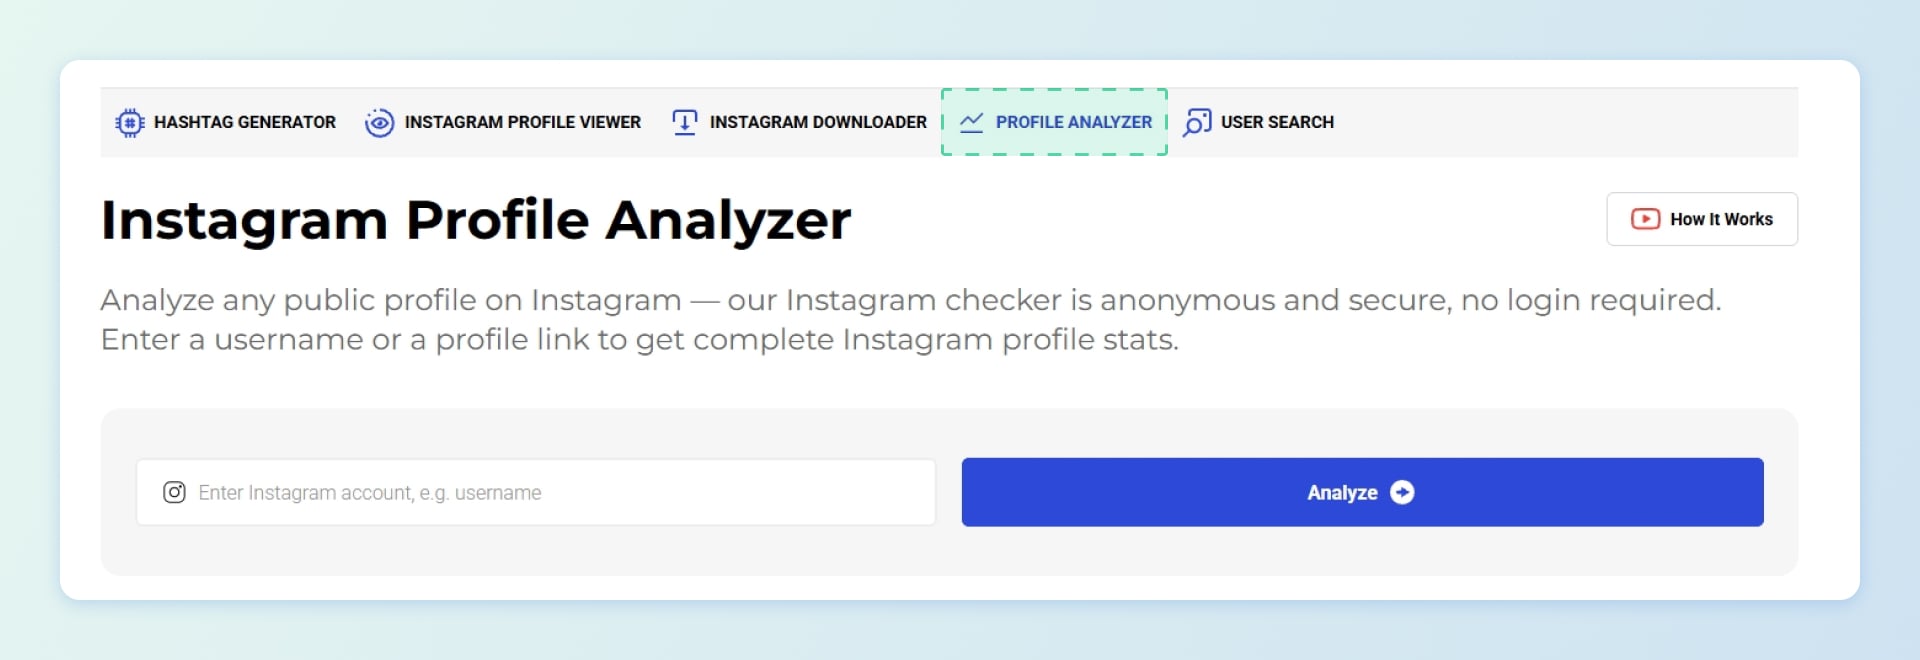
Step 1: Access the tool
Go to Inflact Profile Analyzer.
Step 2: Enter your competitor's username
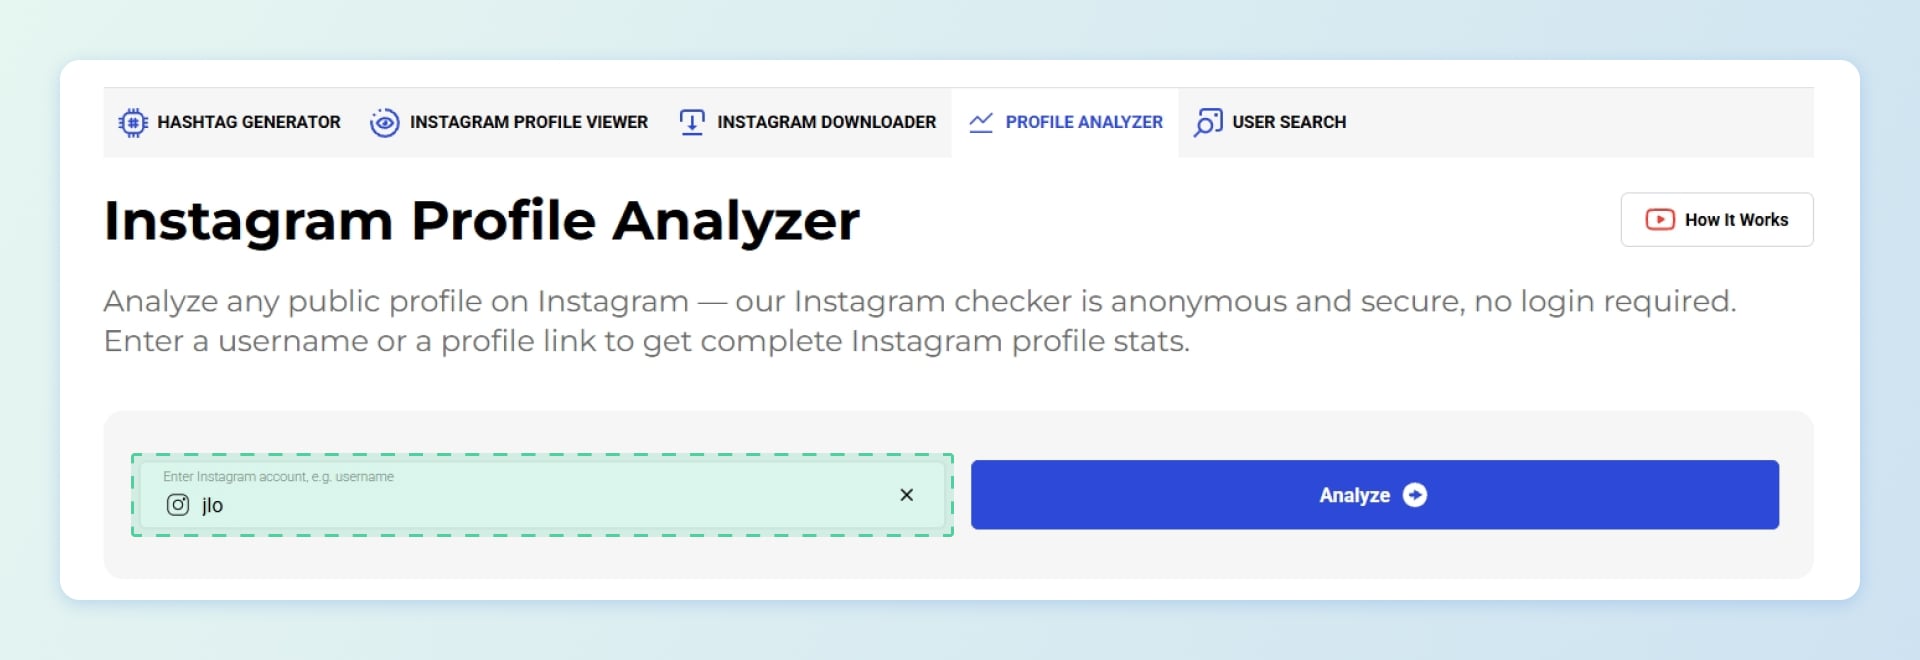
In the main search field, type the Instagram username of the competitor you want to analyze (e.g., @competitor_brand). The tool will scan their public profile and generate a detailed report.
Step 3: Analyze their Engagement Rate (ER)
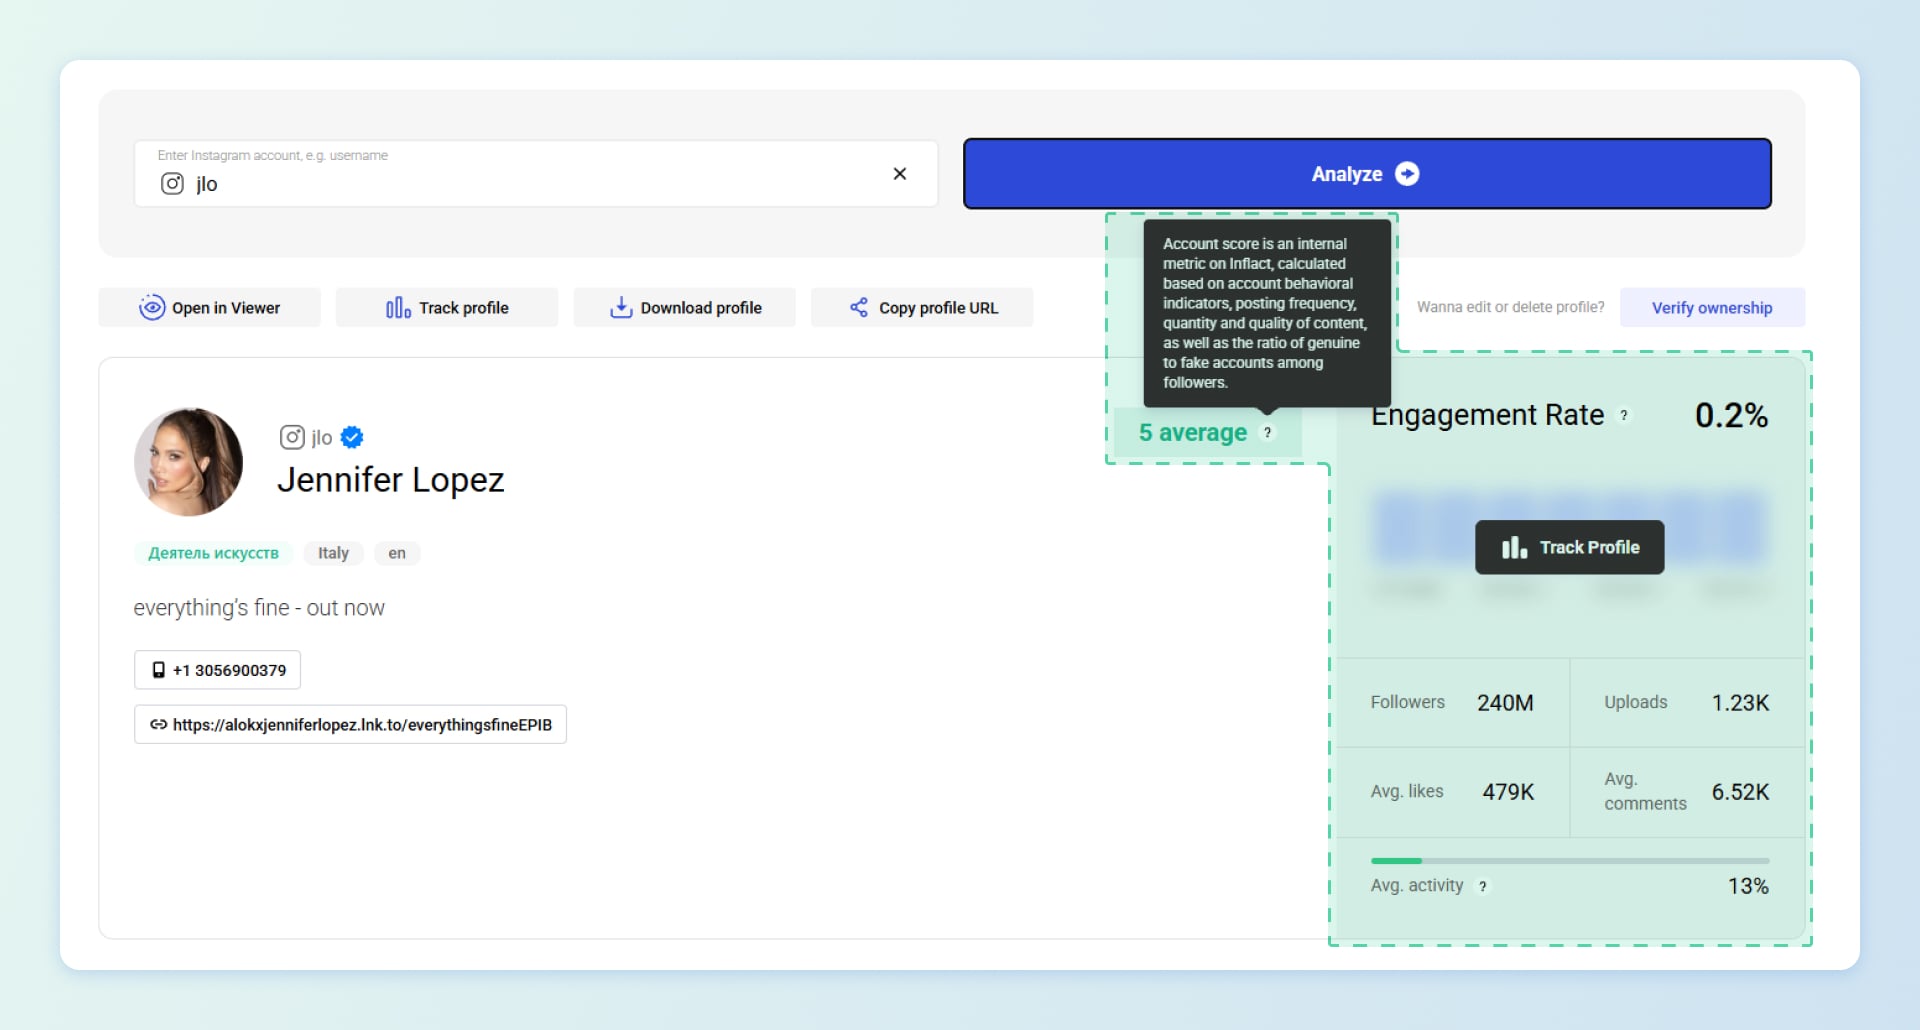
Scroll down to find the Engagement Rate section. This is calculated using the formula: average number of likes and comments per post divided by total followers, multiplied by 100 .
Why this matters:
- A higher percentage means stronger audience connection and more relevant content.
- Compare their ER to industry benchmarks. For reference, average Instagram engagement rates by industry range from 3% to 4.4%.
- If a competitor has 100K followers but only 1% ER, their audience may be inactive or inflated.
Pro tip: Check the Account Score as well. This internal Inflact metric evaluates behavioral indicators, posting consistency, content quality, and the ratio of real to suspicious followers.
Step 4: Review their Rankings
Further down, you'll find Inflact rankings broken into three categories :
- Worldwide ranking: Position globally among profiles in the same category.
- Country ranking: Position within a specific country.
- Category ranking: Position within a niche in a particular country.
Example: If a competitor ranks 17th in "Community" in Italy, they're among the top 20 accounts in that niche. This tells you how competitive they are and whether they're worth studying closely or partnering with .

Step 5: Examine their audience and follower trends
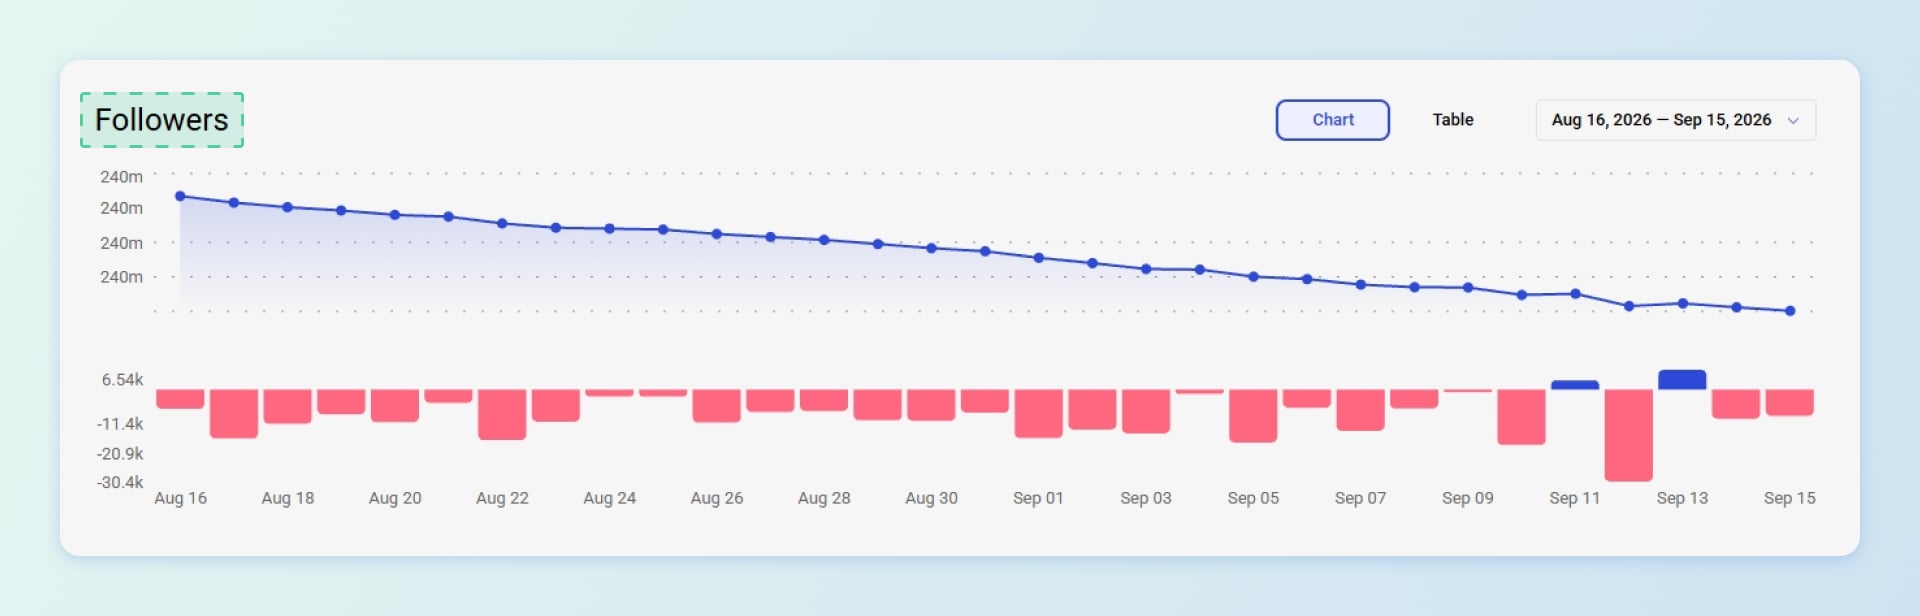
Go to the Followers section. Here you can :
- Track how follower count changes over time.
- Detect sudden spikes (possible viral moments or purchased followers).
- Identify drops (lost interest, controversy, or algorithm changes).
- Compare growth patterns across different time periods.
What to look for:
- Steady, organic growth suggests healthy audience building.
- Sharp spikes followed by drops may indicate fake followers or temporary viral content.
- Consistent flat periods mean they need a strategy refresh.
Step 6: Identify their best-performing posts
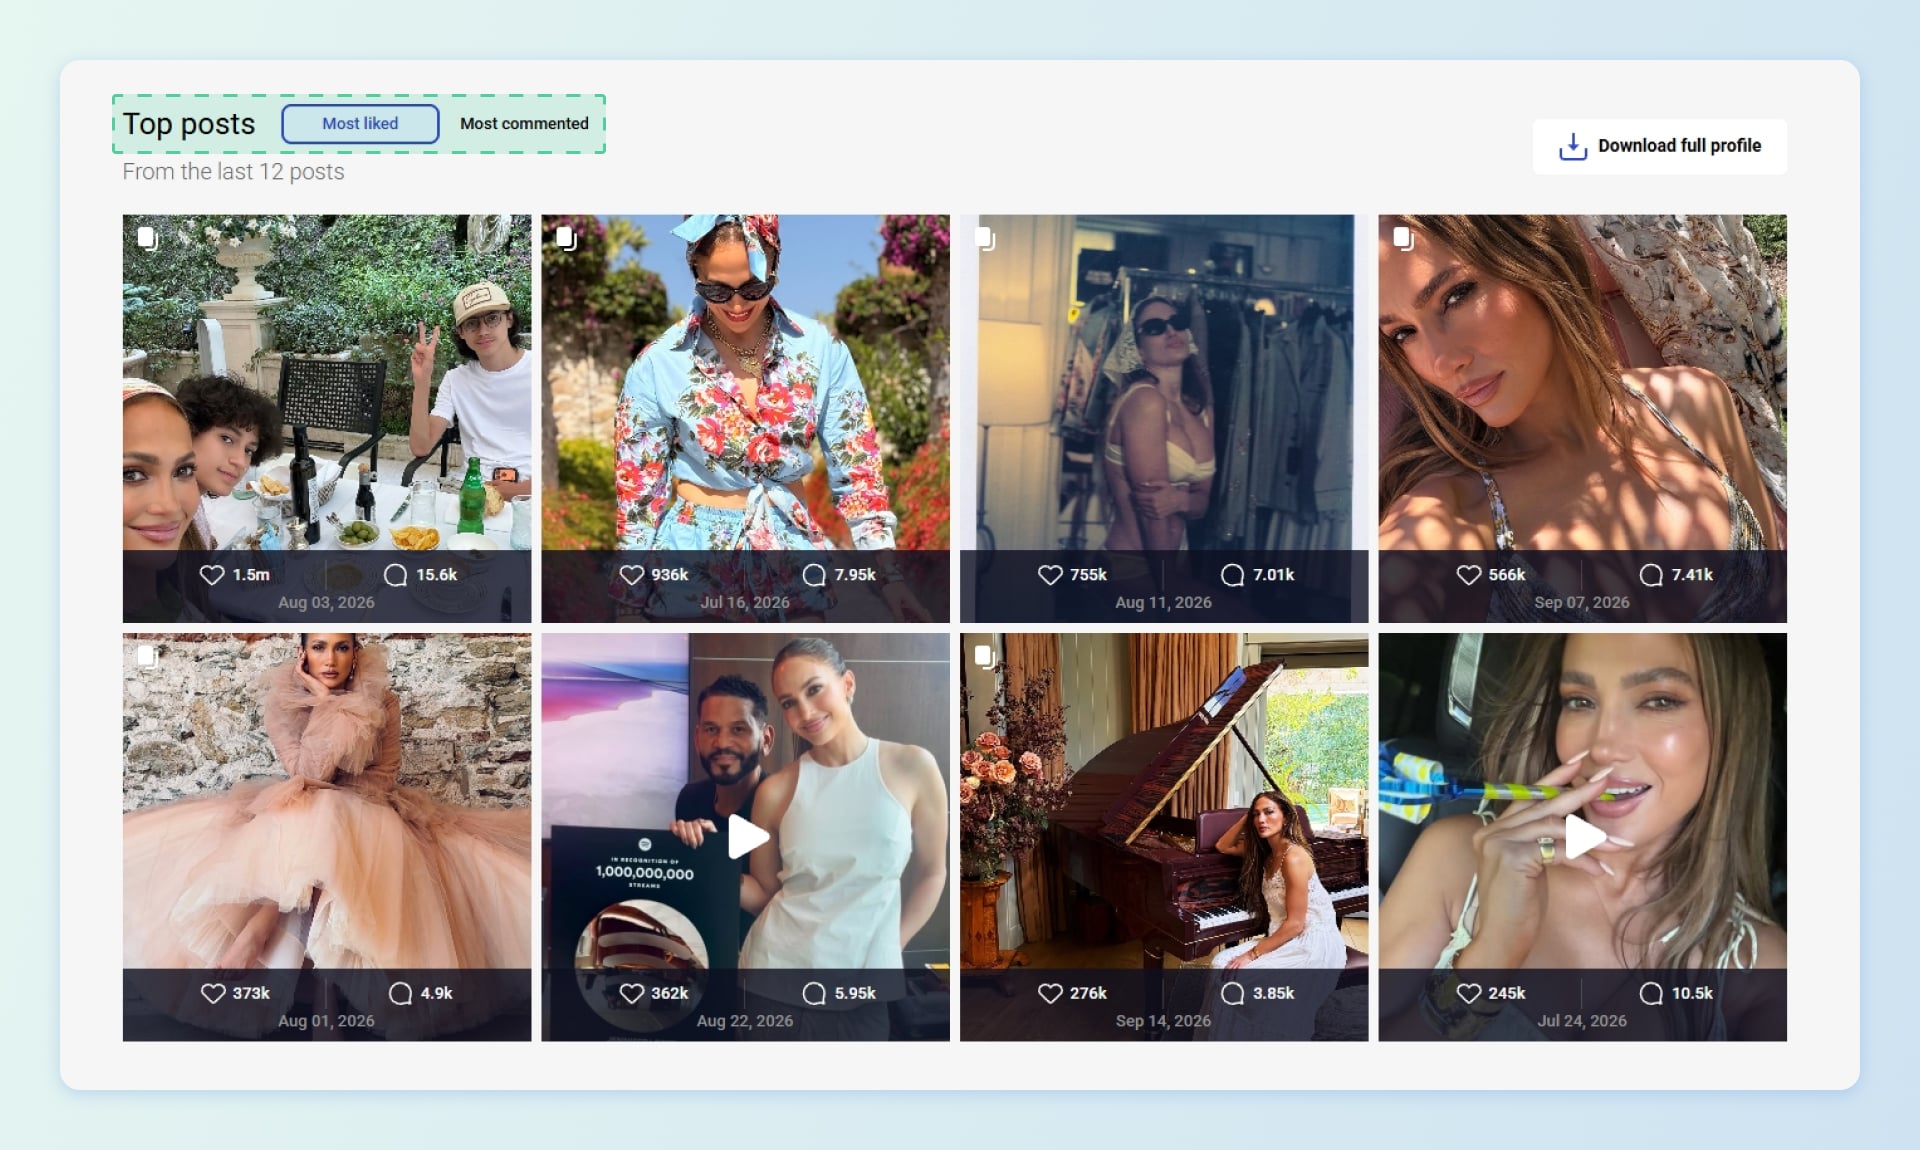
Scroll to the Top Performing Posts section. The tool shows you :
- Most liked posts
- Most commented posts
- Recent Stories performance
How to use this data:
- Click on their top posts to see what format they used (Reel, carousel, static image).
- Analyze the caption structure, hashtags, and posting time.
- Look for patterns: Do their best posts share a common theme, tone, or visual style?
- Check if there are content gaps you can fill- topics they haven't covered but their audience might want.
Step 7: Analyze their posting frequency and timing
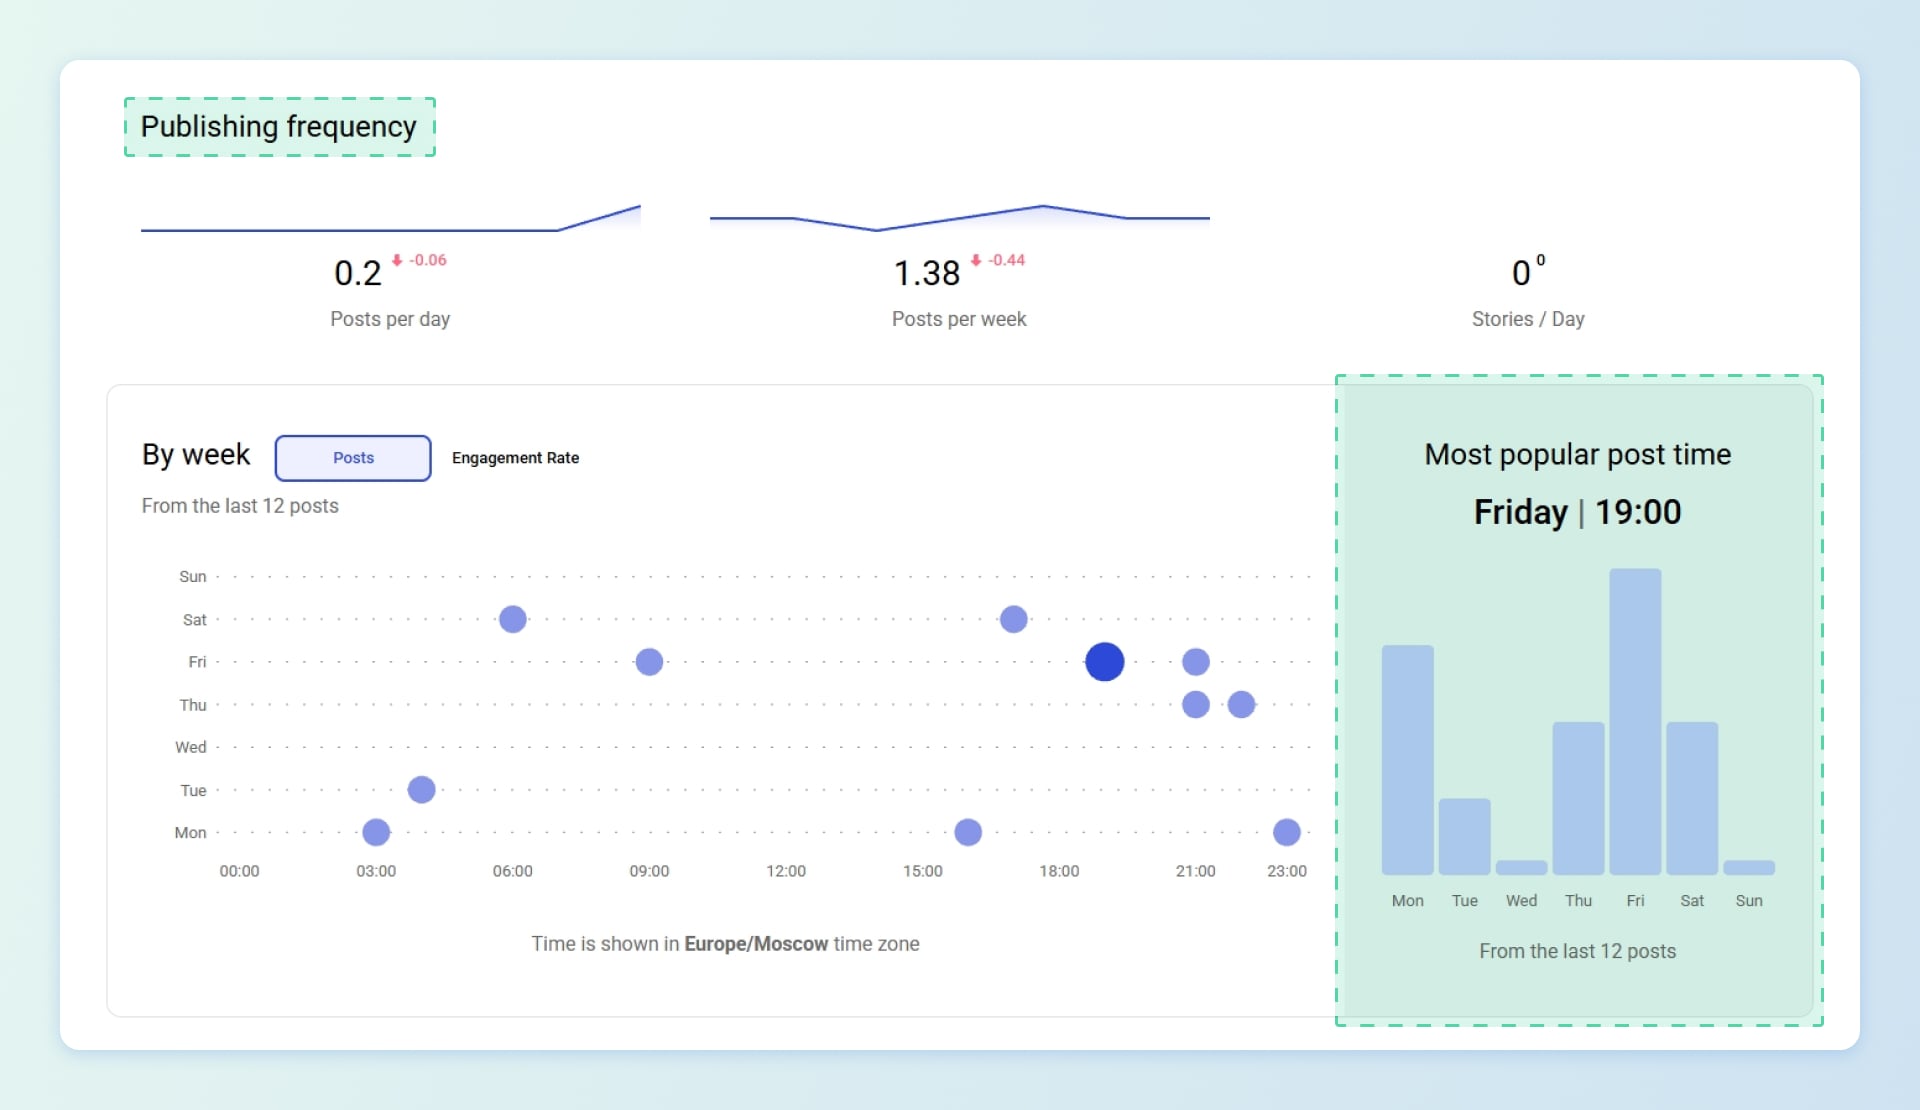
The Publishing Frequency section is one of the most practical features :
- See the best time and days for posting based on their last 100 publications.
- This data reflects real audience behavior specific to their account.
- Use the bar chart to identify which days of the week perform best.
Why this matters for you: If your competitor's audience is most active on Tuesday mornings, you can test similar timing for your own content- or deliberately post at different times to avoid competing for the same attention window.
Step 8: Study their content style and messaging
Two sections help you understand how they communicate :
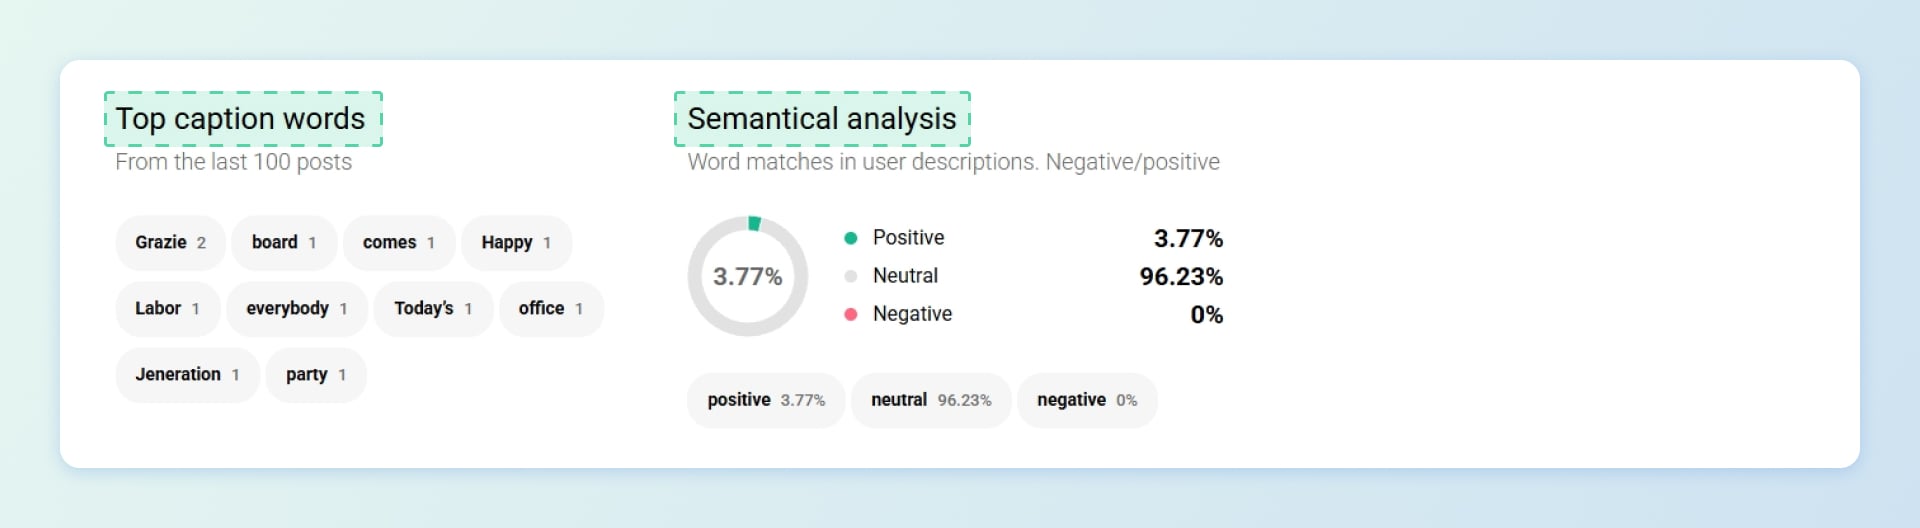
Top Caption Words: The system analyzes their last 100 posts and highlights the most frequently used words and phrases. This reveals:
- Key themes and recurring topics.
- Messaging patterns.
- Keywords that resonate with their audience.
Semantic Analysis: Captions are categorized as positive, neutral, or negative based on keyword analysis. This helps you assess:
- How the account is perceived emotionally.
- Whether they lean into positivity, professionalism, or humor.
- Opportunities to differentiate your tone.
Step 9: Save and track competitors
For ongoing monitoring, use Inflact's Profile Tracker :
- Add competitor profiles to your tracking list.
- Get daily updates on follower changes.
- Monitor likes and comments fluctuations.
- Access historical data to spot long-term trends.
- Click the graph icon next to any tracked profile to jump directly to the Profile Analyzer for deeper insights.
Real Example: Analyzing @natgeo with Profile Analyzer
To show you exactly how this works in practice, let's walk through a real analysis of a public Instagram account. We'll use @natgeo as our example-one of the most followed media brands on Instagram, with a massive, global audience.
Step 1: Entering the username
Open Profile Analyzer and type natgeo into the search field. Within seconds, the tool generates a complete report. No login required, no password needed.
Step 2: Reading the main metrics
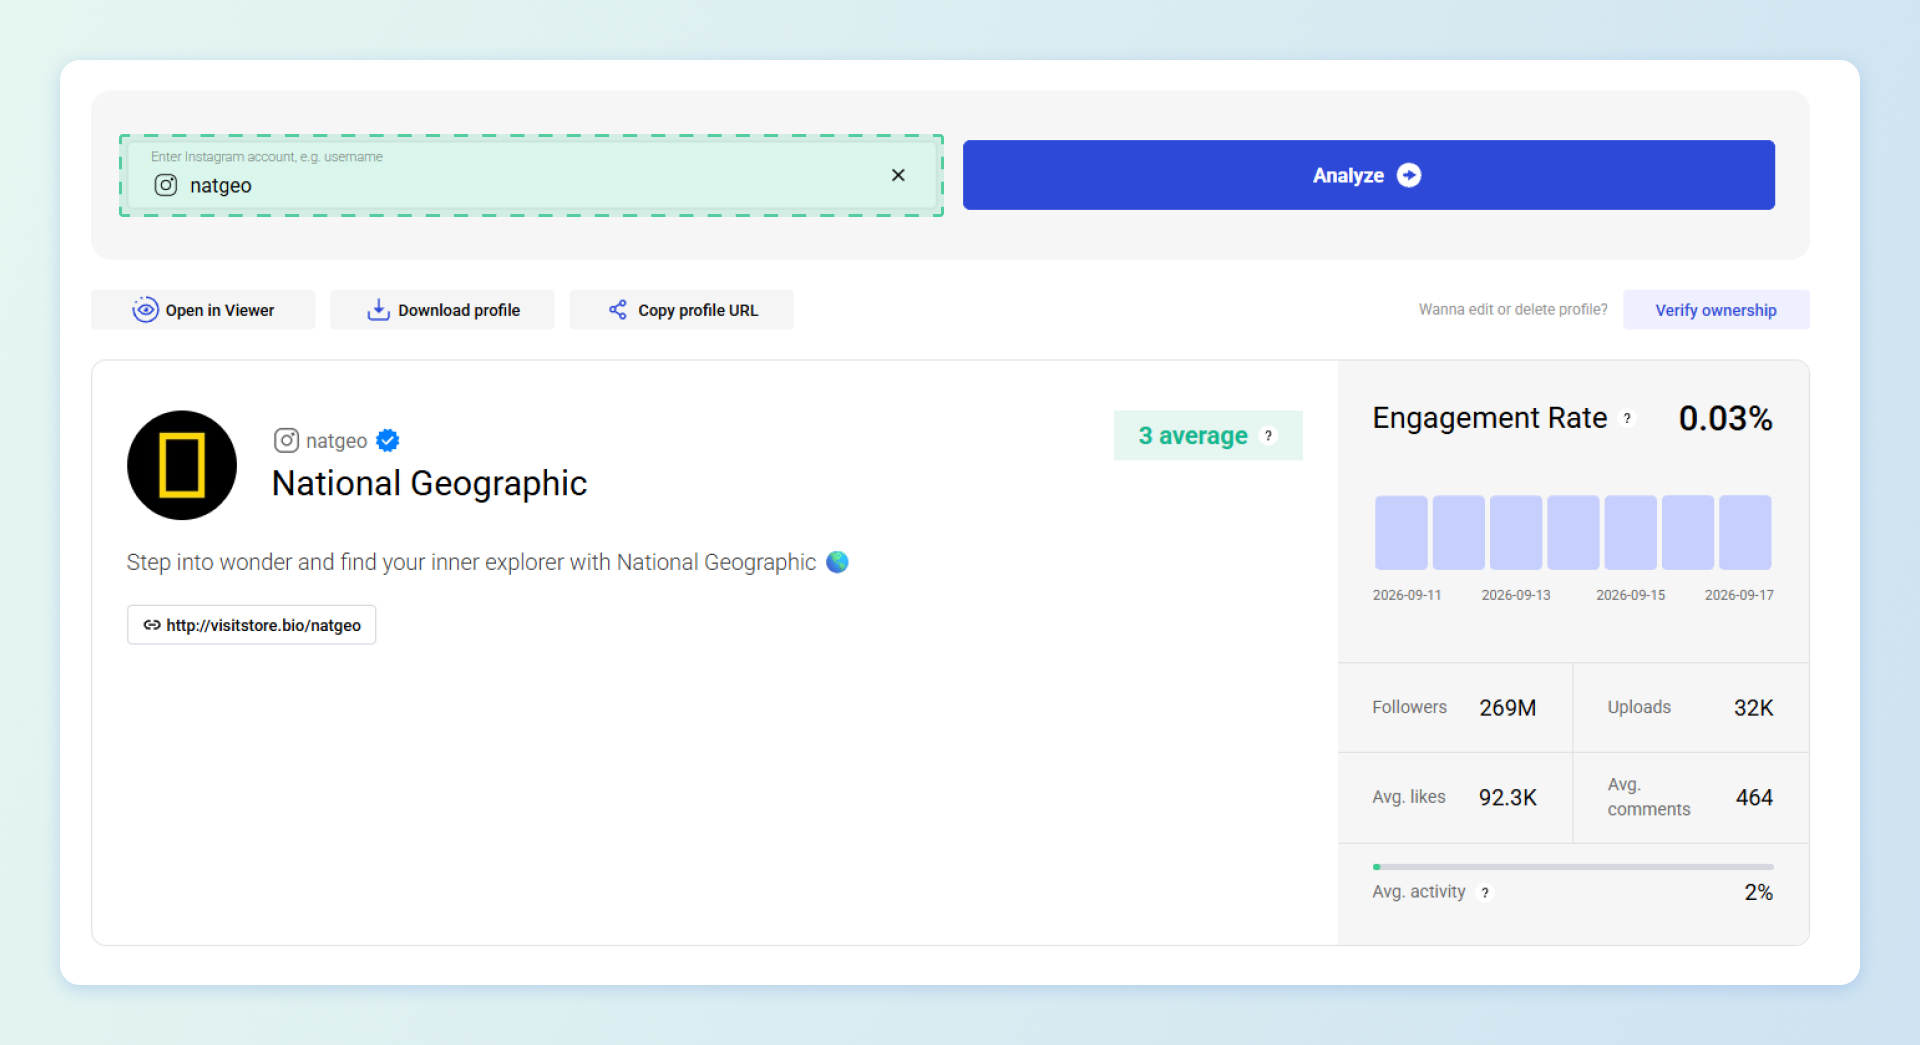
At the top of the report, we see the key numbers:
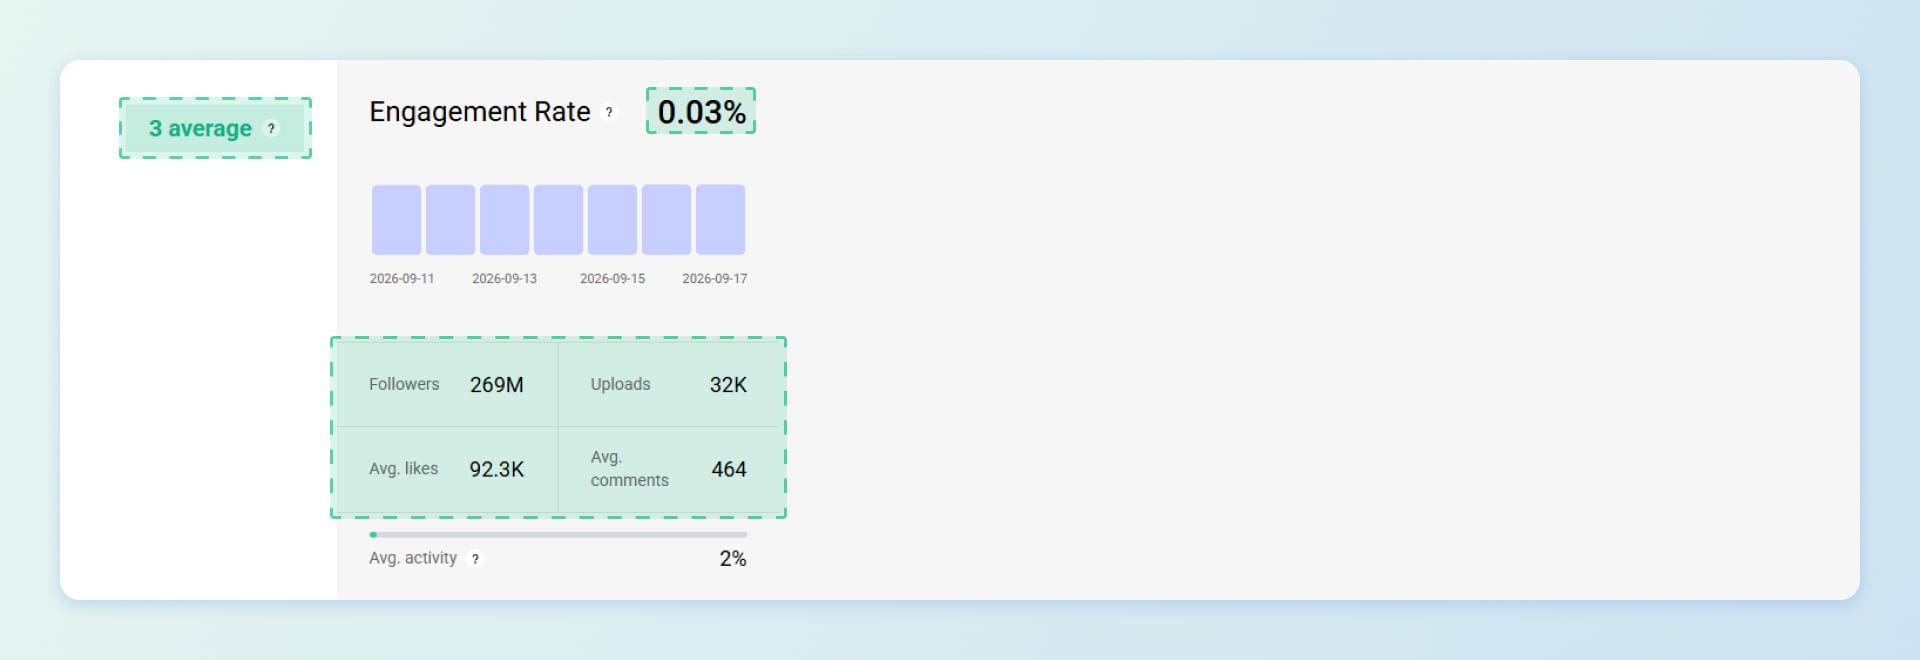
What we conclude: With nearly 270 million followers, @natgeo has one of the largest audiences
on Instagram. But here's the critical finding: an engagement rate of just 0.03% is extremely low-even for an account of this size. This is a red flag worth investigating.
Let's put this in perspective. Industry benchmarks suggest that even mega-accounts typically maintain ER between 0.5% and 1.5%. An ER of 0.03% means that for every 10,000 followers, only about 3 engage with a post. That's a fraction of what healthy engagement looks like at any scale.
What this tells us: @natgeo's massive follower count may not translate into an active, engaged community. Possible explanations include:
- A significant portion of followers are inactive, dormant, or fake
- The account's content no longer resonates with its audience
- Instagram's algorithm is limiting reach, so even loyal followers don't see the posts
- The account has shifted strategy in a way that disconnected its original audience
This is exactly the kind of insight Profile Analyzer is designed to surface-numbers that look impressive on the surface but tell a different story when you dig deeper.
Step 3: Checking rankings
The tool shows @natgeo's position:
- Worldwide ranking: #2 in the Science category on Instagram
What we conclude: @natgeo holds the #2 worldwide ranking in the Science category but this ranking is likely based on follower count and historical authority, not current engagement quality. This is an important distinction: rankings can be misleading if they don't account for ER. A smaller account with 500K followers and 3% ER may be far more valuable for partnerships than a 269M account with 0.03% ER.
Step 4: Analyzing follower trends
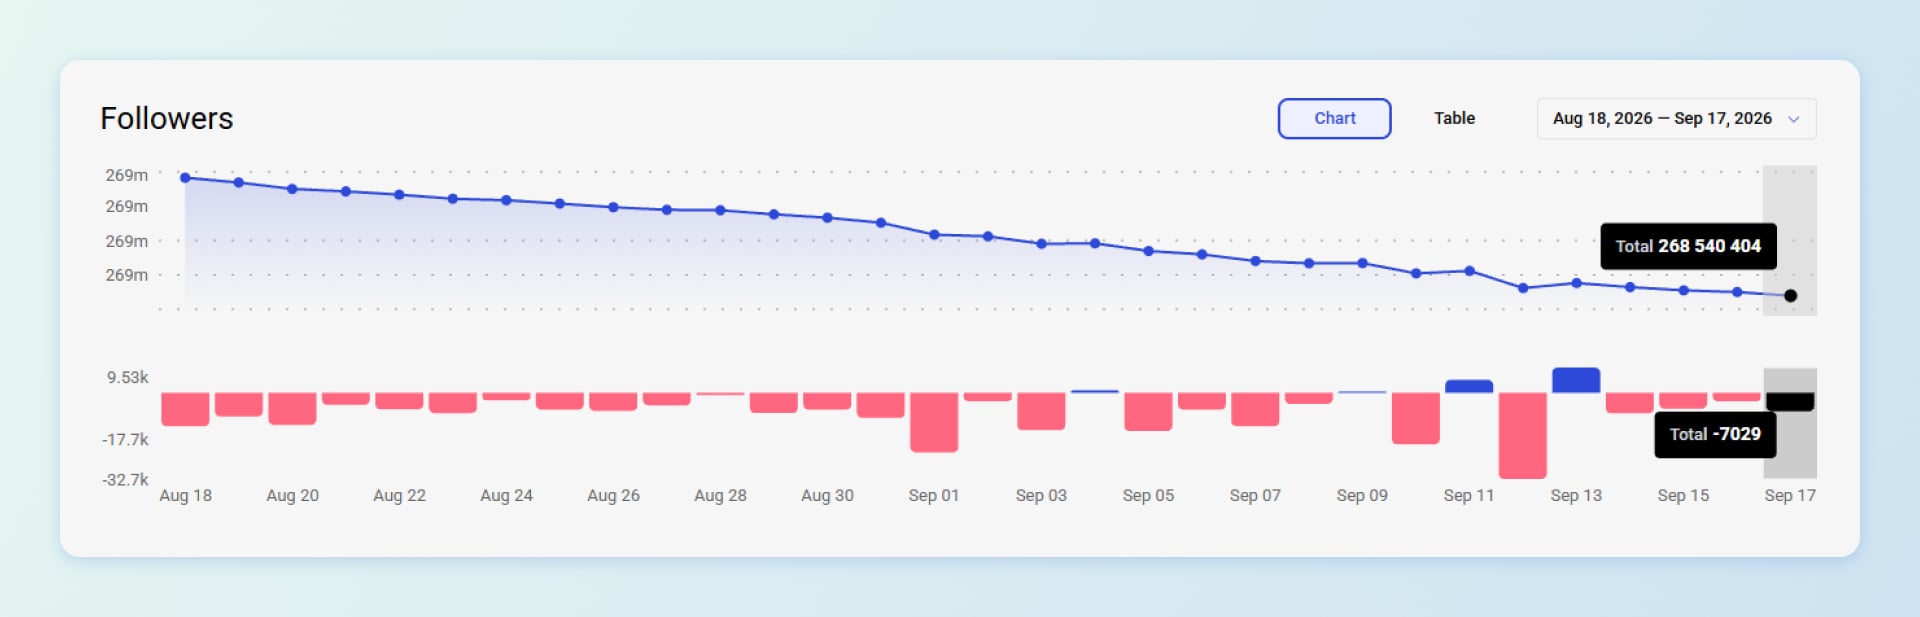
The Followers graph reveals an interesting pattern:
- @natgeo has been experiencing a steady decline in followers over the past month (Aug 18 – Sep 17, 2026).
- The account recorded a net loss of -7,029 followers over this period.
- The follower count ended at 268,540,404 -down from ~269M at the start.
- Daily fluctuations show drops of 3,000–17,700 followers on most days.
- The single largest drop occurred around Sep 11–12, reaching nearly -17.7K in one day.
- Small gains (blue bars) appeared around Sep 12–13—likely a brief viral moment-but they were not enough to reverse the trend.
What we conclude: Even massive accounts experience follower fluctuations. But combined with the extremely low ER of 0.03%, this downward trend takes on new meaning. It's not just normal fluctuation- it may signal that the account is losing touch with its audience. When followers leave AND engagement is minimal, the problem is likely content-audience mismatch, not just algorithmic noise.
Step 5: Identifying top-performing posts
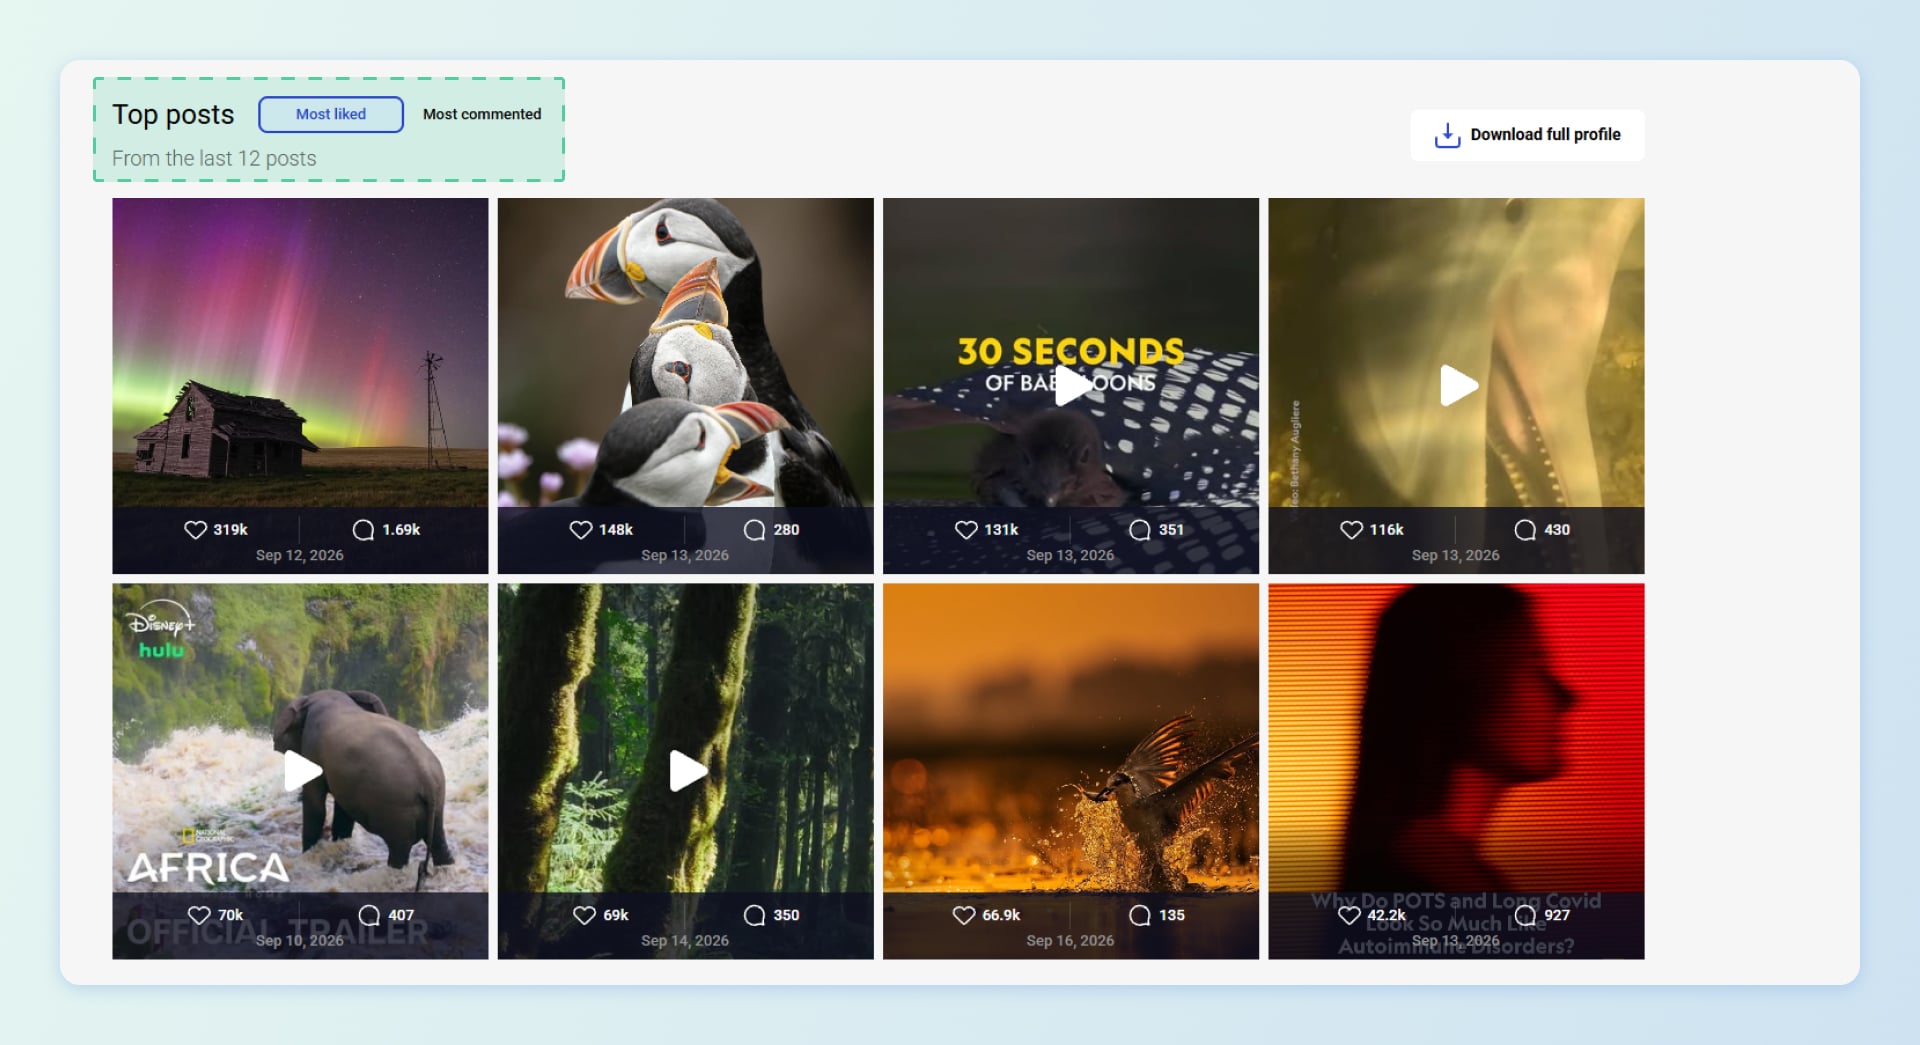
The Top Performing Posts section reveals:
- Most liked post: The image of a weathered farmhouse standing alone under a brilliant aurora borealis, its green and magenta rays lighting up the night sky above an empty prairie—this image resonated with hundreds of thousands of followers and became one of @natgeo's top-performing posts in September 2026.
- Most commented posts: Wildlife conservation stories and striking nature photography tend to generate the highest comment volumes.
- Format: The account predominantly uses static images-high-quality photography remains their signature format
What we conclude: @natgeo's top posts prove that their audience can engage deeply-when the content hits the right emotional chord. The image of a weathered farmhouse standing alone under a brilliant aurora borealis proves that point. But here's the paradox: if their best posts get millions of likes, why is the average ER only 0.03%? The answer: those viral moments are rare exceptions. The vast majority of their 31,800+ posts generate minimal engagement, dragging the average down. This tells us their content strategy is inconsistent-they occasionally strike gold, but most posts don't resonate.
Step 6: Examining posting frequency and timing
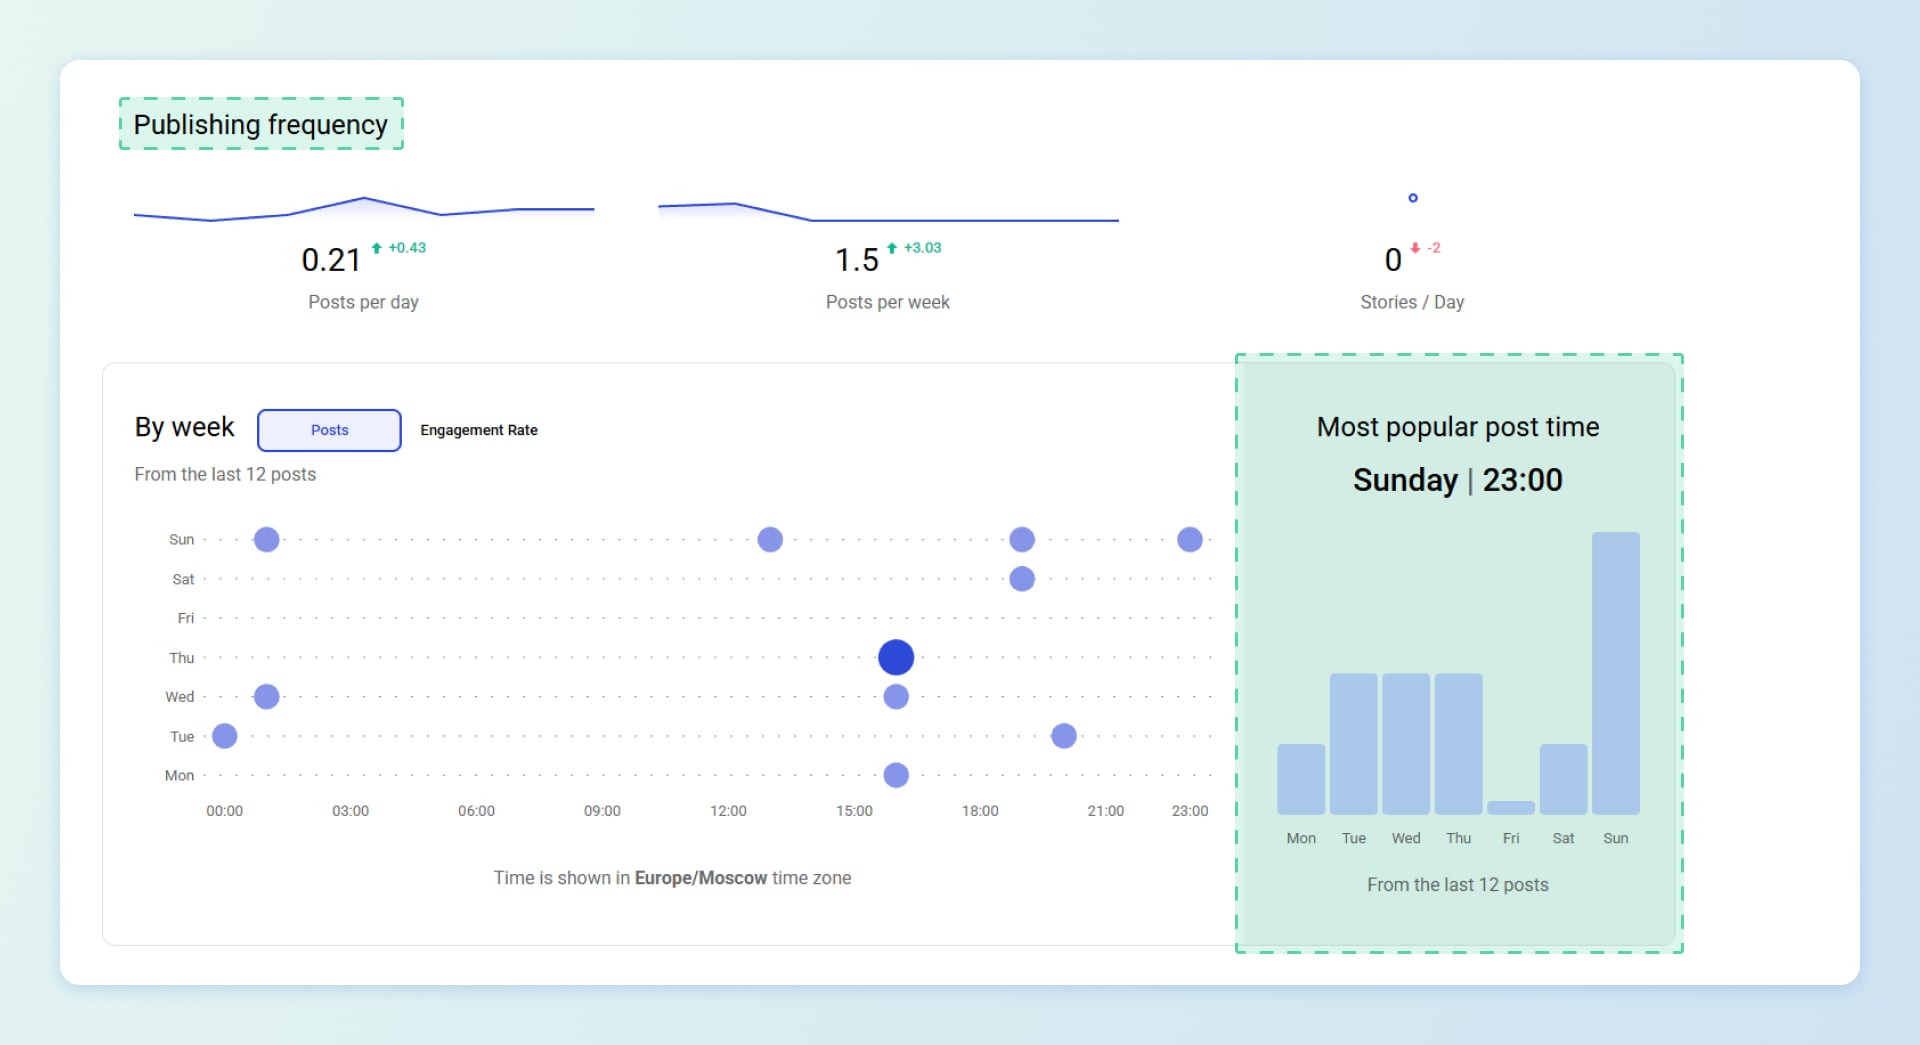
The Publishing Frequency data reveals the following strategy:
- @natgeo publishes only 0.21 posts per day -roughly 1.5 posts per week.
- The account publishes 0 Stories per day.
- Posting activity has increased slightly (+0.43 posts/day, +3.03 posts/week) compared to the previous period.
- Based on the last 12 posts, there is no consistent schedule- posts are scattered across different days and times.
- Sunday at 23:00 is the single most popular posting slot.
- Thursday stands out as the most active individual moment (largest dot at ~16:00).
- Friday is the least active day.
What we conclude: @natgeo's strategy is low-frequency not high-volume as one might expect from a 269M-follower account. Posting just 1.5 times per week means the account appears in followers' feeds only about 6 times per month. Combined with a 0.03% ER and zero Stories activity, this raises a strategic question: is under-posting contributing to the account's follower decline? For smaller accounts, the lesson is clear: consistency and stories matter. Don't chase volume for its own sake but don't disappear from your audience's feed either.
Step 7: Studying content style and messaging
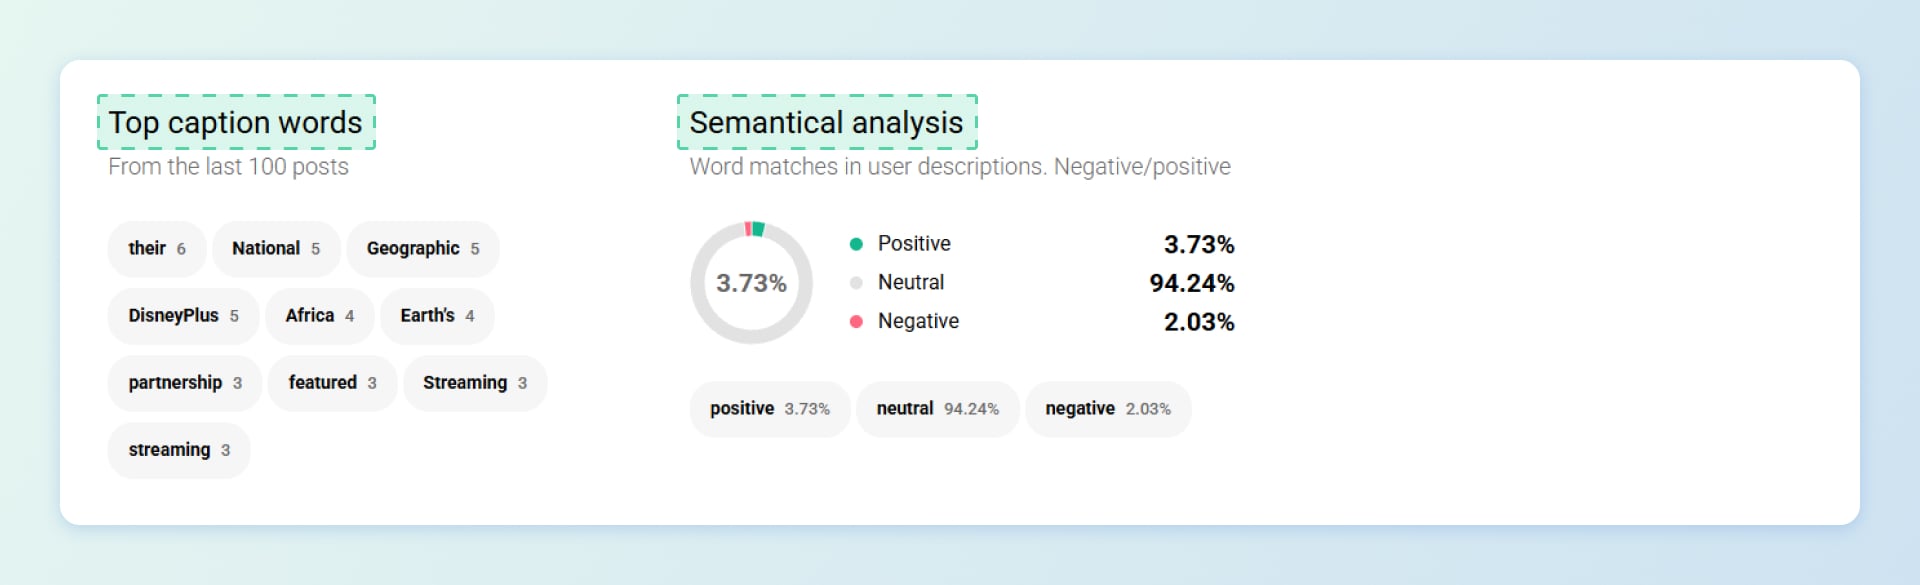
Top Caption Words: Based on analysis of their content, @natgeo's most frequent themes include: "their" "National" , "Geographic", "DisneyPlus", "Africa", "Earth's", "partnership", "featured", "Streaming", "streaming".
Semantic Analysis: The emotional tone of captions is overwhelmingly neutral (94.24%), with only 3.73% positive and 2.03% negative.
What we conclude: the overwhelming majority of @natgeo's captions are neutral-94.24%. Only 3.73% are positive, and 2.03% are negative. This is a strikingly flat emotional profile.
A 94% neutral score means the captions are informational, promotional, or descriptive, not emotionally engaging.
Why this matters: Neutral captions don't create emotional connection. They inform, but they don't inspire. Combined with a 0.03% ER, this suggests that @natgeo's captions may be failing to give followers a reason to stop, feel, and engage.
Final takeaways: @natgeo is a masterclass in how follower count can mask an engagement crisis. With 269M followers but only 0.03% ER, the account illustrates why smart marketers never judge an influencer or competitor by size alone. Profile Analyzer reveals the truth behind the numbers-and that truth is often more valuable than the surface metrics.
Use this insight to evaluate your own competitors critically: a smaller account with 3% ER is likely a far better benchmark (and partnership target) than a mega-account with 0.03%.
Pro Tips from Inflact Support
- Start with 3-5 direct competitors. Deep analysis of a few accounts beats skimming twenty.
- Check for fake followers. Sudden spikes without corresponding engagement increases are a red flag. The Account Score helps identify suspicious patterns .
- Compare across time periods. Use the date range filters to see if a competitor's performance is improving or declining.
- Look for content gaps. Identify what topics, formats, or angles your competitors are missing-that's your opportunity .
Quick checklist before you start your analysis
|
Check |
Item |
|
✅ |
You have a list of 3-5 direct competitors in your niche |
|
✅ |
You know your industry's average engagement rate for benchmarking |
|
✅ |
You've identified what you want to learn (content ideas, timing, audience insights) |
|
✅ |
You plan to save findings in a document or spreadsheet for comparison |
|
❌ |
Don't analyze private profiles—the tool cannot access them |
|
✅ |
You're ready to look beyond vanity metrics to understand their strategy |
What to do with your findings
After analyzing a competitor, you should have:
- A clear picture of their engagement health- are they genuinely connecting with their audience?
- A list of their top-performing content- what formats and topics work best for them?
- Audience insights- when are their followers most active, and what resonates emotionally?
- Ranking context - how do they compare to others in your niche?
- Ideas for differentiation- what are they NOT doing that you could own?
Use these insights to refine your own content calendar, test new formats, and set realistic benchmarks for your growth.
Inflact's Profile Analyzer is a powerful tool for understanding any public Instagram account. It goes far beyond what Instagram's native interface offers, enabling marketers, businesses, and content creators to make data-driven decisions about their competitive strategy.
Ready to analyze your first competitor? Open Profile Analyzer and enter any username to get started. If you encounter any issues, contact our support team via chat or email at hello@inflact.com.
-
Why manual competitor analysis doesn't work
-
What makes Inflact Profile Analyzer different
-
Key capabilities:
-
How to use Profile Analyzer for competitor research step by step
-
Step 1: Access the tool
-
Step 2: Enter your competitor's username
-
Step 3: Analyze their Engagement Rate (ER)
-
Step 4: Review their Rankings
-
Step 5: Examine their audience and follower trends
-
Step 6: Identify their best-performing posts
-
Step 7: Analyze their posting frequency and timing
-
Step 8: Study their content style and messaging
-
Step 9: Save and track competitors
-
Real Example: Analyzing @natgeo with Profile Analyzer
-
Step 1: Entering the username
-
Step 2: Reading the main metrics
-
Step 3: Checking rankings
-
Step 4: Analyzing follower trends
-
Step 5: Identifying top-performing posts
-
Step 6: Examining posting frequency and timing
-
Step 7: Studying content style and messaging
-
Pro Tips from Inflact Support
-
Quick checklist before you start your analysis
-
What to do with your findings
Related Articles



Significant benefits